
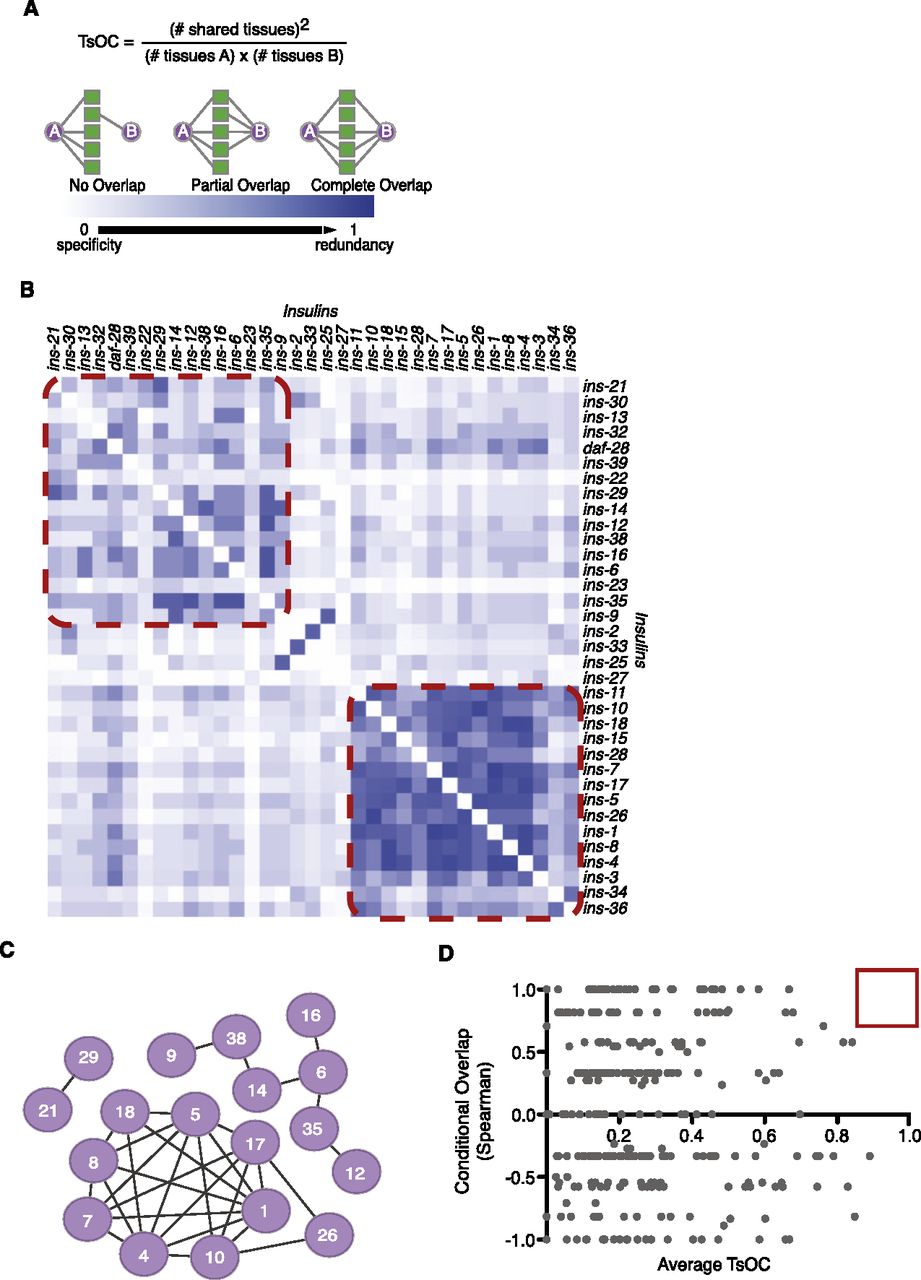
Comparing insulin gene expression illustrates specificity and overlap in expression. (A) Tissue overlap coefficients (TsOCs) define the expression overlap between all pairwise insulins (A,B). Insulins (circles) exhibit GFP expression (edges) in C. elegans tissues (squares). A TsOC of 1 indicates complete overlap while a TsOC of 0 indicates no overlap in expression. (B) Tissue overlap matrix using TsOC scores from the young adult stage. Red boxes highlight visually delineated clusters of highly overlapping insulins. (C) Coexpression network of insulins (circles) that share the top 5% average TsOC scores through six larval/adult stages. An edge represents an average TsOC ≥ 0.68; maximum average TsOC = 0.89 (ins-4 and ins-5). (D) No gene pairs (red box) share the same expression in both conditional (as measured by a Spearman rank test) and developmental tissue expression. TsOC is presented as an average of the six TsOC values for each developmental stage.


