
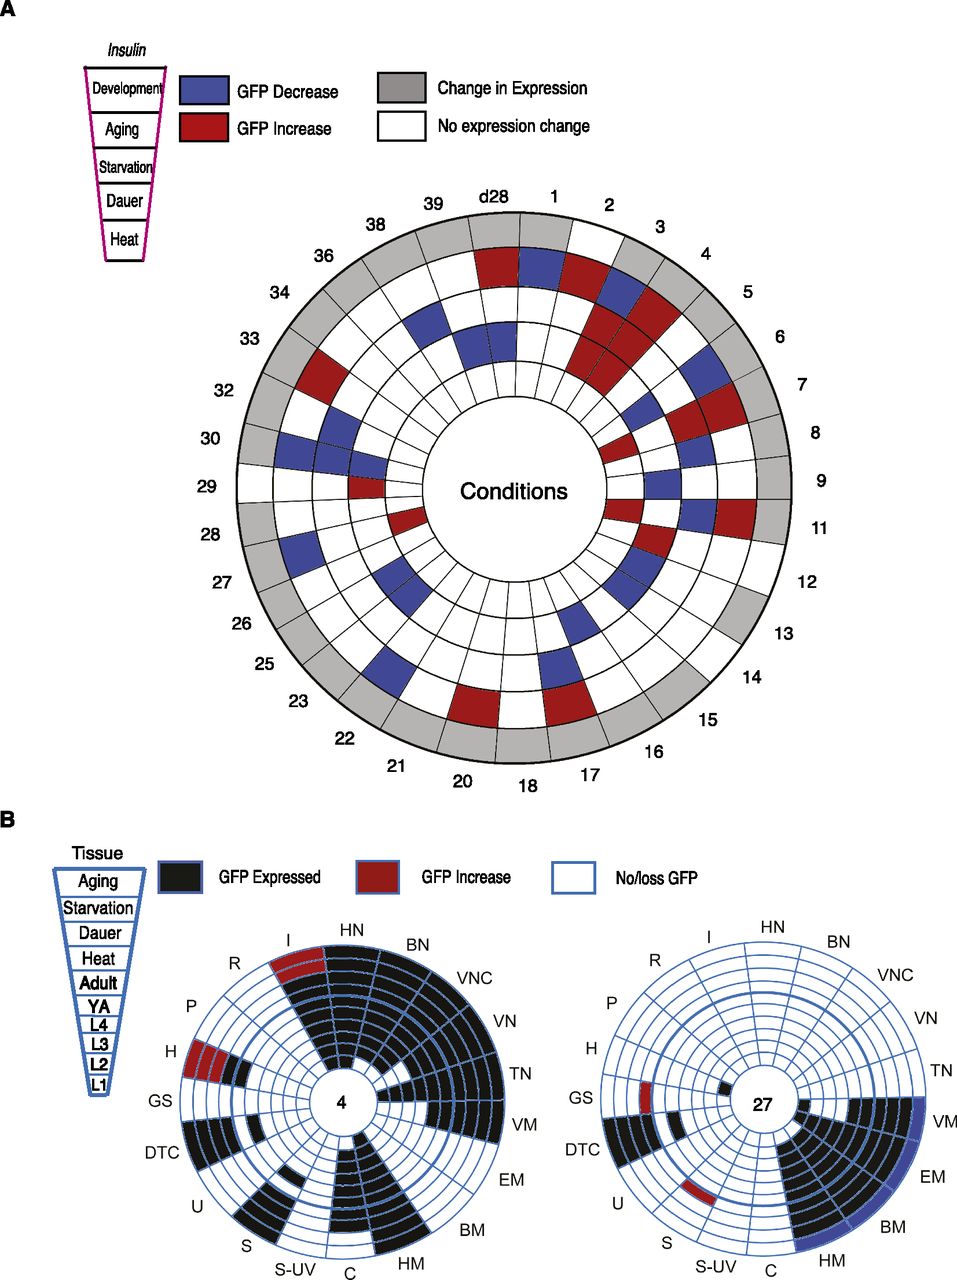
Conditional dynamics of insulin expression. (A) Dartboard depicting conditional changes in insulin expression. Each ring represents a condition; starting from the center, heat stress, dauer, starvation, aging, and development. Each slice represents a different insulin. For each condition, activity is defined by at least one tissue exhibiting an increase (red) or decrease (blue) in GFP expression. Changes in expression pattern (gray) were recorded throughout development. (B) Dartboards depicting gene-centered view of insulin expression. Each ring represents a developmental stage or condition, starting from the center: L1, L2, L3, and L4, young adult, and adult (∼3- to 4-d-old adult), heat stress, dauer, starvation, and aging. Each slice represents a tissue with GFP expression (black), no GFP (white) expression. Compare conditional changes to the young adult stage (fifth ring). Red indicates a GFP increase; black, no change in GFP expression; white, no GFP observed. (Left) Dartboard of ins-4 expression; (right) dartboard of ins-27 expression.


