
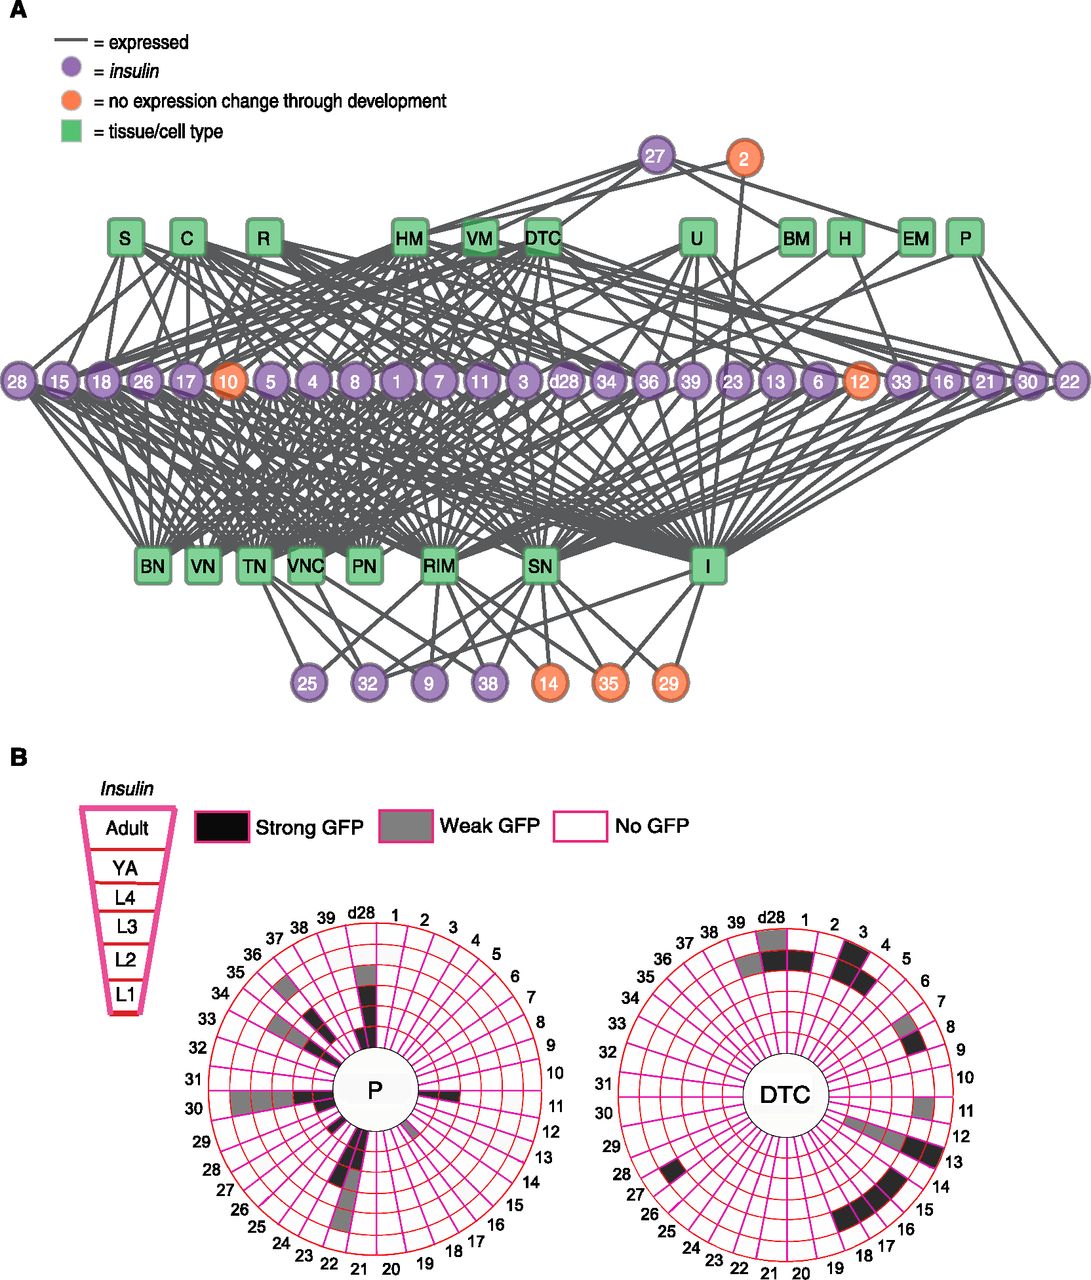
Insulin expression networks illustrate dynamic tissue activity. (A) Bipartite network connecting 35 insulins to cell/tissues at the young adult stage. Pins-20∷GFP animals did not exhibit GFP expression at the young adult stage and were excluded. Circles represent insulins; squares represent cells/tissues. (S) Spermatheca; (C) ceolomocytes; (R) rectum; (HM) head muscle; (VM) vulva muscle; (DTC) distal tip cell; (U) uterus; (BM) body muscle; (H) hypodermis; (EM) enteric muscle; (P) pharynx; (BN) body neuron(s); (VN) vulva neuron(s); (TN) tail neuron(s); (VNC) ventral nerve cord; (PN) pharyngeal neuron(s); (RIM) ring/intermotor neuron(s); (SN) sensory neuron(s); (I) intestine. Purple circles indicate insulins that change in spatial expression through development; orange circles are insulins that do not change. The network is organized as follows: (top to bottom) insulins with no neuronal expression; non-neuronal tissues (excluding the intestine); insulins with neuronal and non-neuronal tissue expression; neuronal tissues and the intestine, insulins with only neuronal and/or intestinal expression. (B) “Dartboards” depicting tissue-centered view of insulin expression. Each ring represents a developmental stage, starting from the center: larval stages L1, L2, L3, and L4, young adult, and adult with eggs (∼3- to 4-d-old adult). Each slice represents an insulin with strong GFP (black), weak GFP (gray), or no GFP (white) expression. (Left) Dartboard profile of the pharynx (P); (right) dartboard profile of the distal tip cell (DTC).


