
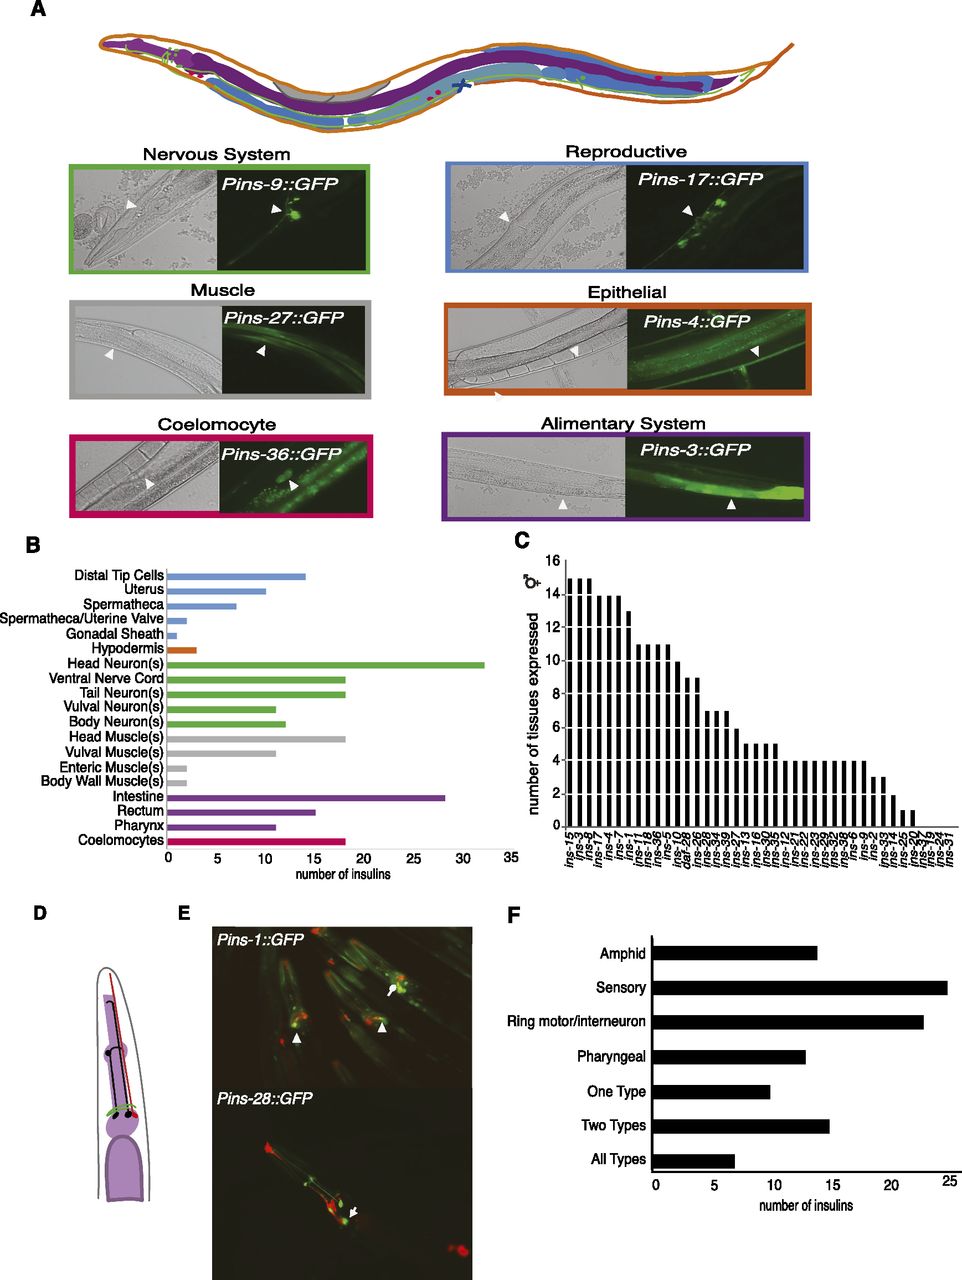
Spatial expression of the 36/40 insulins expressed in C. elegans young adult hermaphrodites. (A, top) Cartoon of a C. elegans hermaphrodite with colors illustrating insulin expression in six major tissue types: nervous system (green), reproductive tissue (blue), muscle (gray), epithelial tissue (orange), coelomocytes (pink), and alimentary system (purple). (B) Number of insulins expressed in each tissue/cell type. Colors correspond to the six major tissue types in A. (C) Number of tissues/cell types in which each insulin is expressed. (D) Cartoon of three head neuron categories: sensory (red), pharyngeal (black), ring motor/interneurons (green). (E) Two examples: Pins-1∷GFP exhibits GFP expression in many head neurons including amphid sensory neurons (arrowheads) and ring interneurons (circle arrow). Pins-28∷GFP exhibits GFP expression in pharyngeal, but not amphid neurons (arrows). Amphid neurons were visualized by DiI staining (red). Yellow indicates that GFP expression (green) occurred in amphid neurons (red). (F) Summary of neuronal insulin expression in three types of head neurons: sensory, ring motor/interneuron, and pharyngeal. Insulins that exhibited overlapping GFP expression and DiI staining are defined as having amphid expression.


