
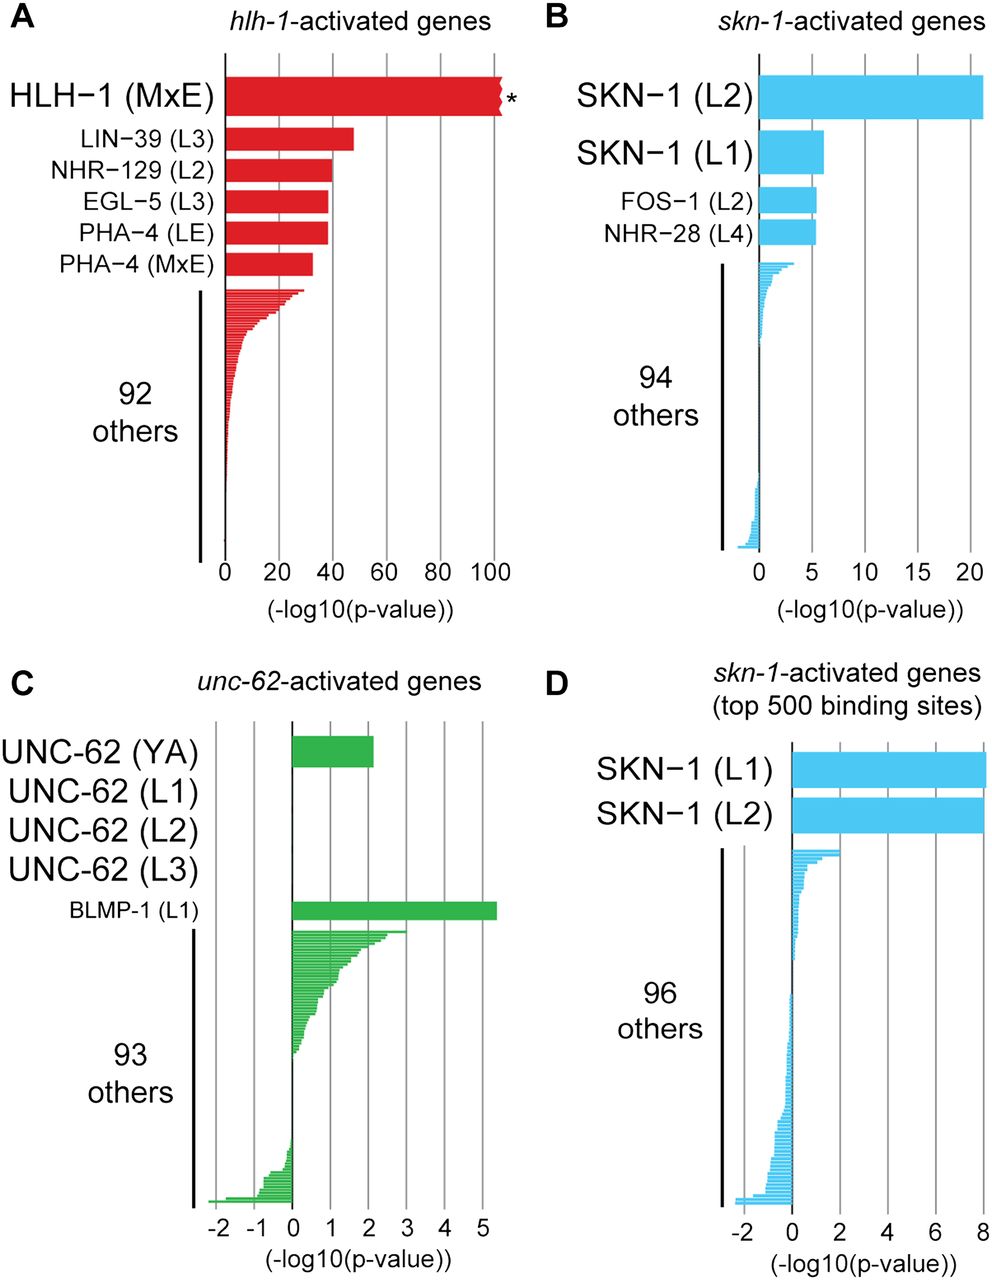
Identifying candidate regulators of expression profiling data sets. To predict candidate regulators of genes altered in expression profiling experiments, low-complexity targets from each of the 98 ChIP-seq data sets were compared against (A) 2128 genes activated by hlh-1 (Fukushige et al. 2006; Fox et al. 2007), (B) 91 genes activated by skn-1 (Park et al. 2009), or (C) 115 genes decreased upon knockdown of unc-62 (Van Nostrand et al. 2013). For each ChIP-seq data set (y-axis), the x-axis indicates the overlap between low-complexity targets and genes altered in the transcriptome profiling experiment, with enrichment indicated by positive values and depletion by negative values. (A) HLH-1 low-complexity ChIP-seq targets in mixed embryos (MxE) showed the greatest enrichment for hlh-1–activated genes ([*] P < 10−100, χ2 = 1047 by Yates' χ2 test). (B) SKN-1 targets in L2 larvae (P = 6.3 × 10⁻²²), followed by SKN-1 targets in L1 larvae (P = 7.5 × 10⁻⁷) showed the greatest enrichment for skn-1–activated genes. (C) UNC-62 targets did not correlate with unc-62-activated genes, potentially indicating that most genes with decreased expression upon unc-62 knockdown are secondary targets of UNC-62. (D) To control for the different number of targets between ChIP-seq data sets, we developed a score (based on a naïve Bayes classifier) for each binding site that reflects both the binding site significance (Q-value) as well as binding site complexity. This classifier was trained on the set of HLH-1 ChIP-seq targets and hlh-1–activated genes, and the 500 binding sites for each ChIP-seq data set with the highest scores were then tested on skn-1–activated genes. By use of this method, SKN-1 targets showed the greatest correlation (3.6-fold enriched, P = 7.9 × 10⁻⁹ in L1 larvae and 5.1-fold enriched, P = 9.8 × 10⁻⁹ in L2 larvae) for skn-1–activated genes.


