
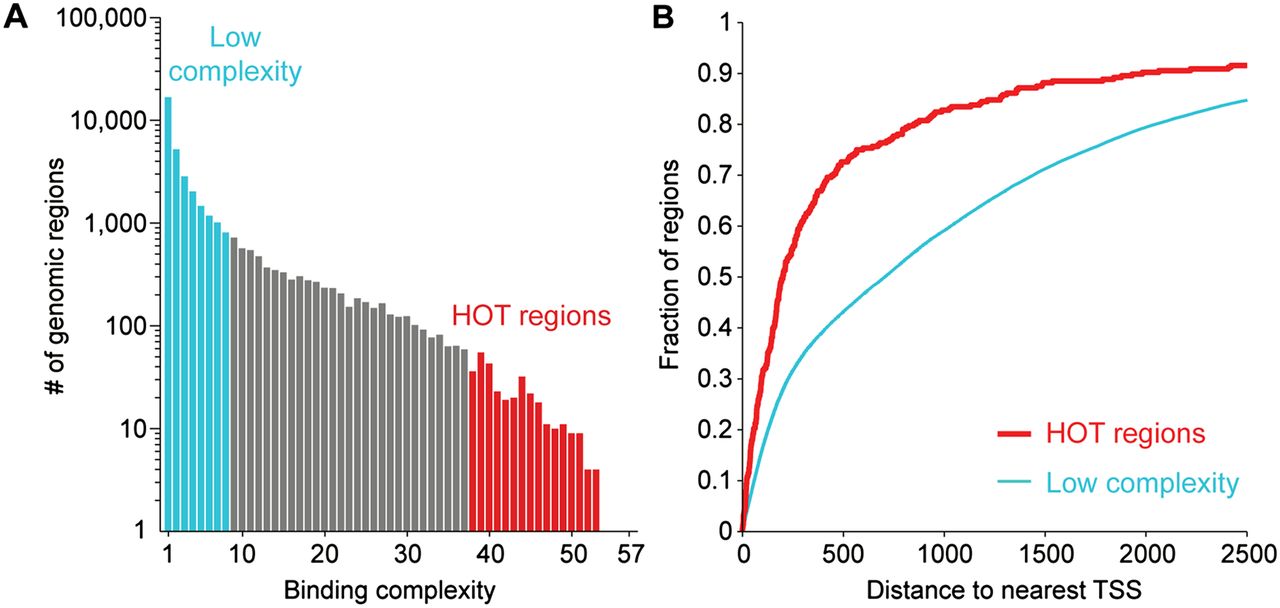
Highly occupied target (HOT) regions. (A) The histogram indicates the number of genomic regions observed for different binding complexities. In blue, thousands of low-complexity regions are bound by eight or fewer factors; in red, 296 HOT regions are bound by 38 or more transcription factors. (B) HOT regions tend to be located close to the transcription start sites (TSSs) of genes. The cumulative distribution plot shows the cumulative fraction of regions (y-axis) that have a maximal distance to the nearest annotated TSS indicated on the x-axis. HOT regions have significantly shorter distances to nearby TSSs than low-complexity regions (P = 1.7 × 10⁻²³; Kolmogorov-Smirnov test). Results shown here are for all annotated genes (WS220); similar results were observed using only protein-coding genes (data not shown).


