
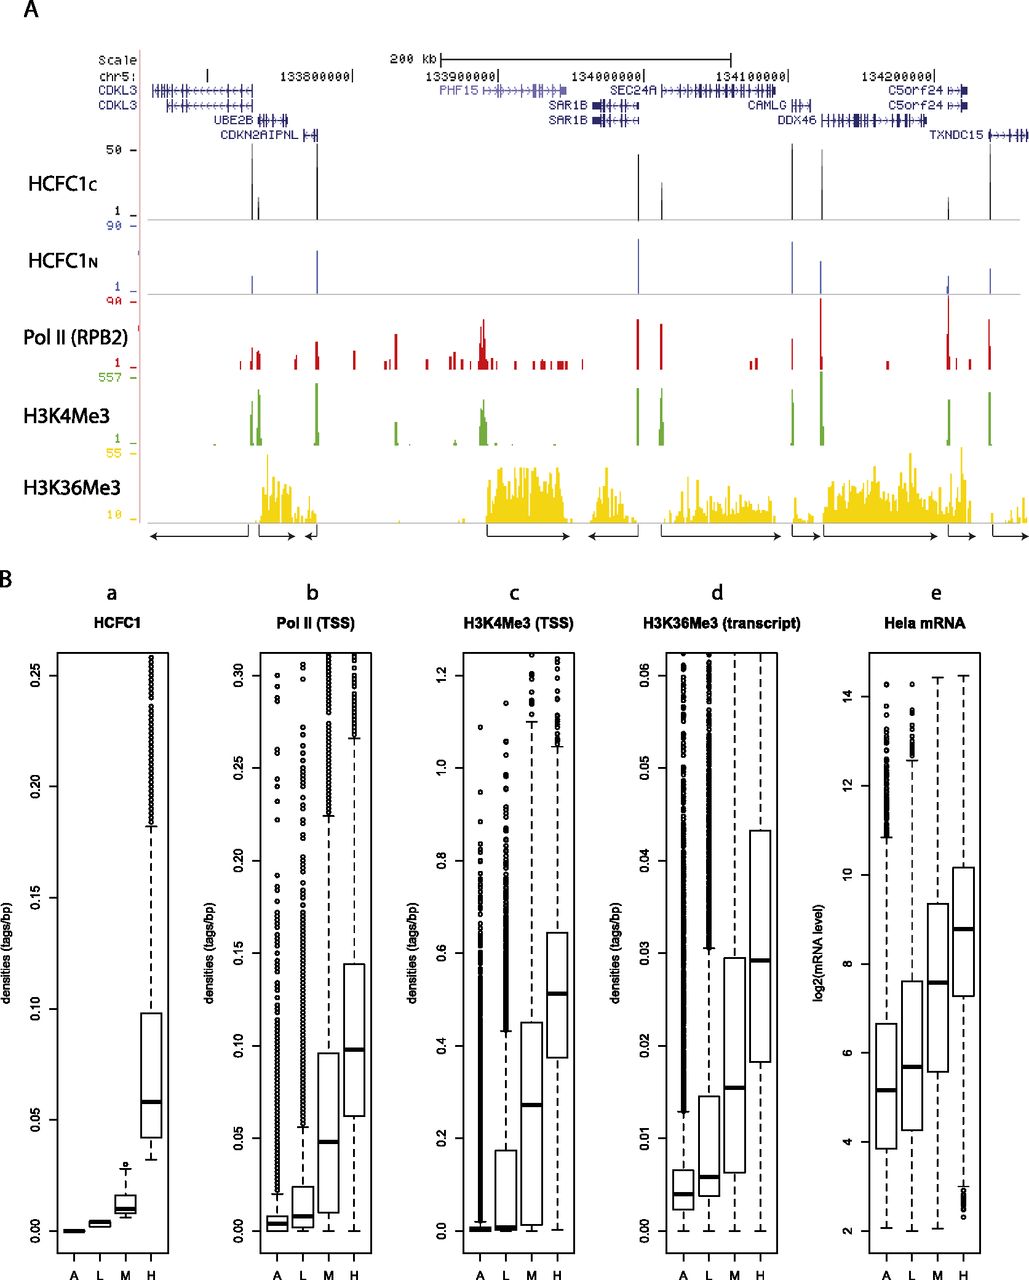
HCFC1 peaks correlate with sites of active promoters. (A) UCSC Genome Browser shot showing a typical distribution of HCFC1C and HCFC1N binding sites together with Pol II, and H3K4Me3 and H3K36Me3 modified histones. (B) TSS regions (−250 to +250 bp from TSSs) were split into four categories according to the density of sequence tags (number of tags centered to the fragment length as in Fig. 1E divided by the number of base pairs, i.e., 500) for HCFC1C (panel a). (A) Absent (density = 0, 6270 transcription units); (L) low density (density > 0 and ≤0.004, 4806 transcription units); (M) medium density (density > 0.004 and ≤0.03, 7902 transcription units); (H) high density (density > 0.03, 3417 transcription units). The sequence-tag densities for Pol II (panel b) and H3K4Me3 (panel c) at promoter regions and H3K36Me3 (panel d) within transcribed regions are shown for each category. The distribution of transcript abundance in log2 of transcripts in HeLa cells is shown for each category (panel e). The results are displayed as boxplots.


