
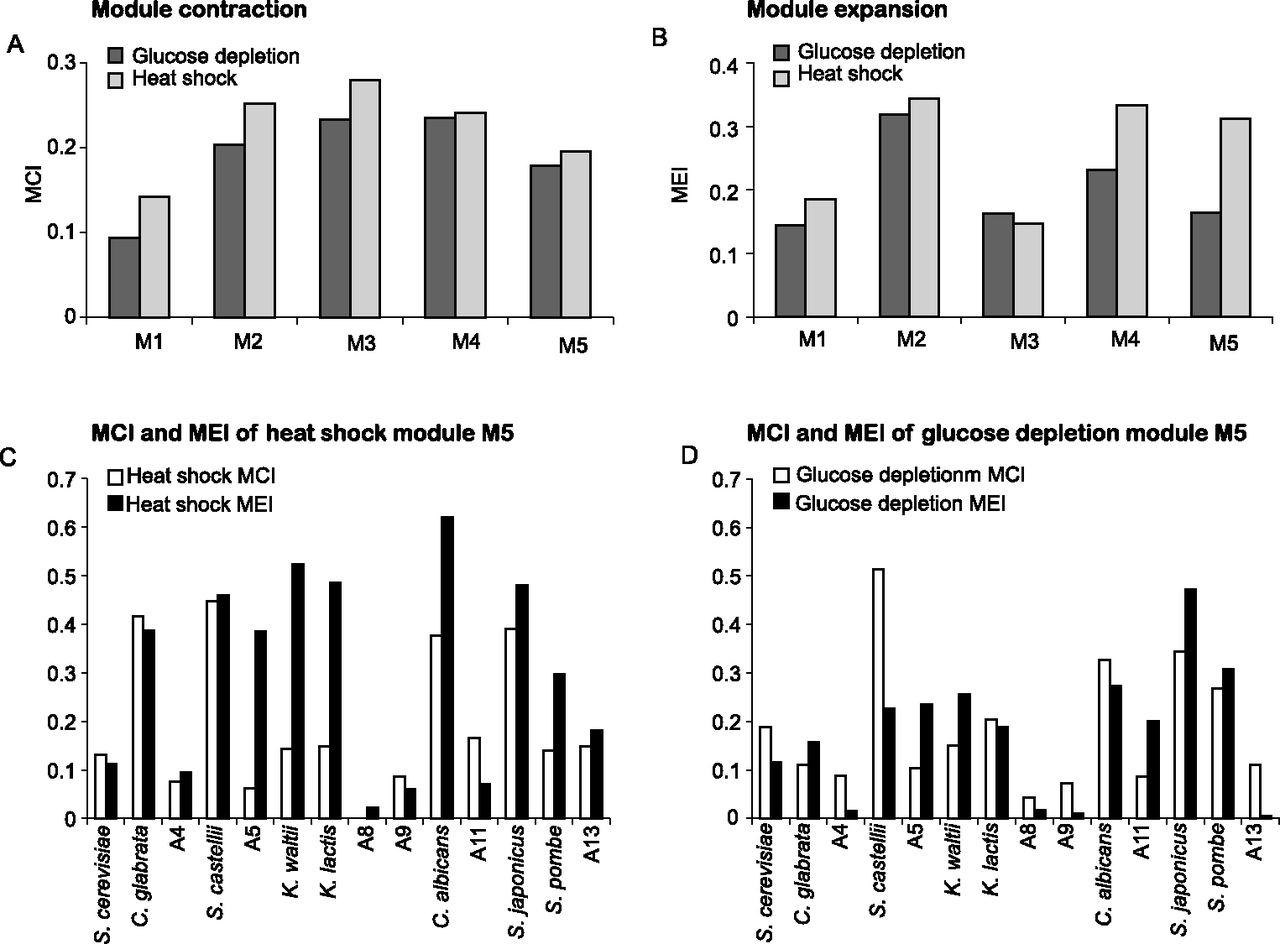
Figure 6.
Module contraction and expansion in heat shock and glucose depletion. (A,B) Module contraction index (A) and module expansion index (B) in heat shock (gray) and glucose depletion (black) for each module M1–M5 (x-axis). Higher bars indicate a greater expansion (contraction) of a module. (C,D) MCI and MEI for the most induced heat shock module (C) and glucose depletion module (D) at individual phylogenetic points (x-axis).


