
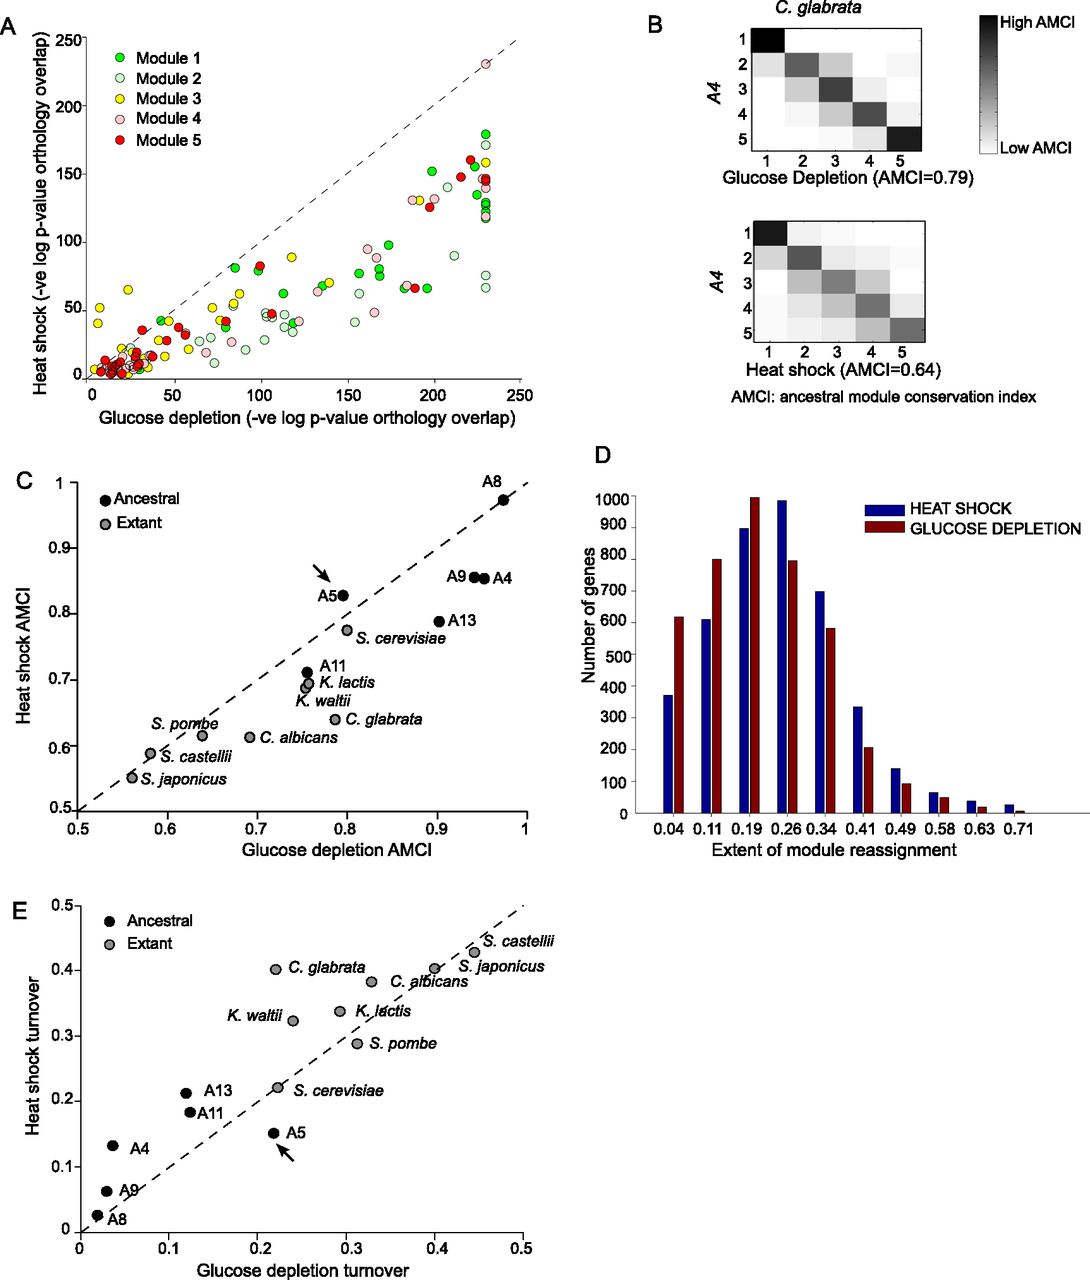
Heat shock modules diverge more than glucose depletion modules. (A) Conservation of gene content in orthologous modules (of the same ID) for a pair of species in heat shock (y-axis) versus glucose depletion (x-axis). All points below the diagonal indicate that conservation of the ‘corresponding’ module pairs is lower in heat shock than in glucose depletion. (B) Ancestral module conservation index (AMCI). Shown are transition matrices learned for C. glabrata in glucose depletion (top) and heat shock response (bottom). The matrix specifies the conditional distribution of modules in C. glabrata given modules in its immediate ancestor, A4. Element intensity is proportional to the probability value. AMCI quantifies the extent to which a species preserves its immediate ancestral module assignment and is calculated as the average of the diagonal elements. (C) Higher AMCI in glucose depletion than in heat shock. Each point in the scatter is the AMCI of all extant species (black circles) and ancestral species (gray circles) in response to heat shock (y-axis) versus glucose depletion (x-axis). (Arrow) WGD ancestor (A5). (D) Higher module reassignment of genes in heat shock than in glucose depletion. Shown is the histogram of the fraction of reassignments (out of the maximum possible) for heat shock (blue) and glucose depletion (red). (E) Module turnover is higher in heat shock than in glucose depletion. Shown is the degree of turnover at each ancestral (black) and extant (gray) species for heat shock (y-axis) versus glucose depletion (x-axis). (Arrow) WGD ancestor (A5).


