
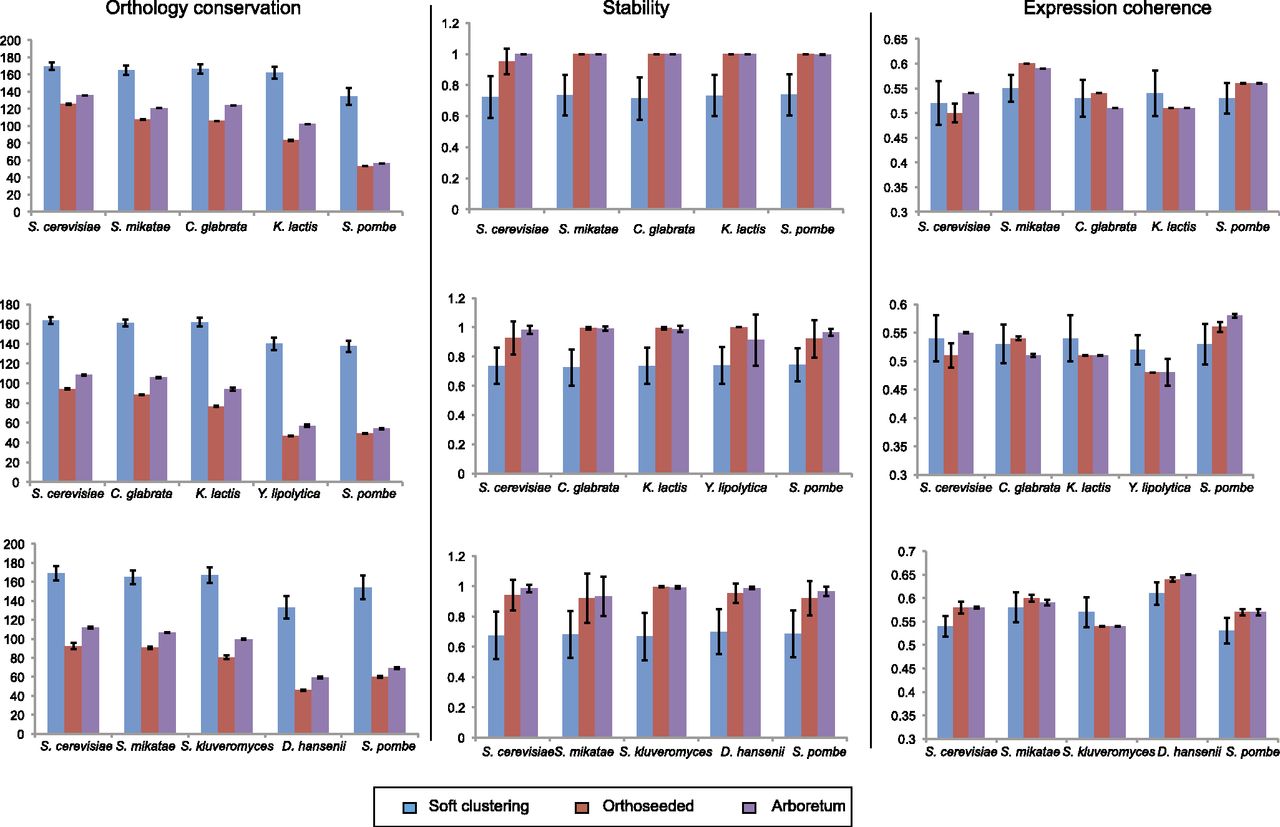
Figure 2.
Performance of Arboretum. Shown is a comparison of Arboretum's performance (purple) to that of soft k-means clustering (blue) and orthoseeded clustering (red), based on degree of ortholog conservation measured as the average negative logarithm of the P-value of the hypergeometric test for significance of overlap across modules (left), module stability (middle), and expression coherence of modules (right), for three different sets of five species each (rows). Error bars were obtained by running each algorithm with different random initializations.


