
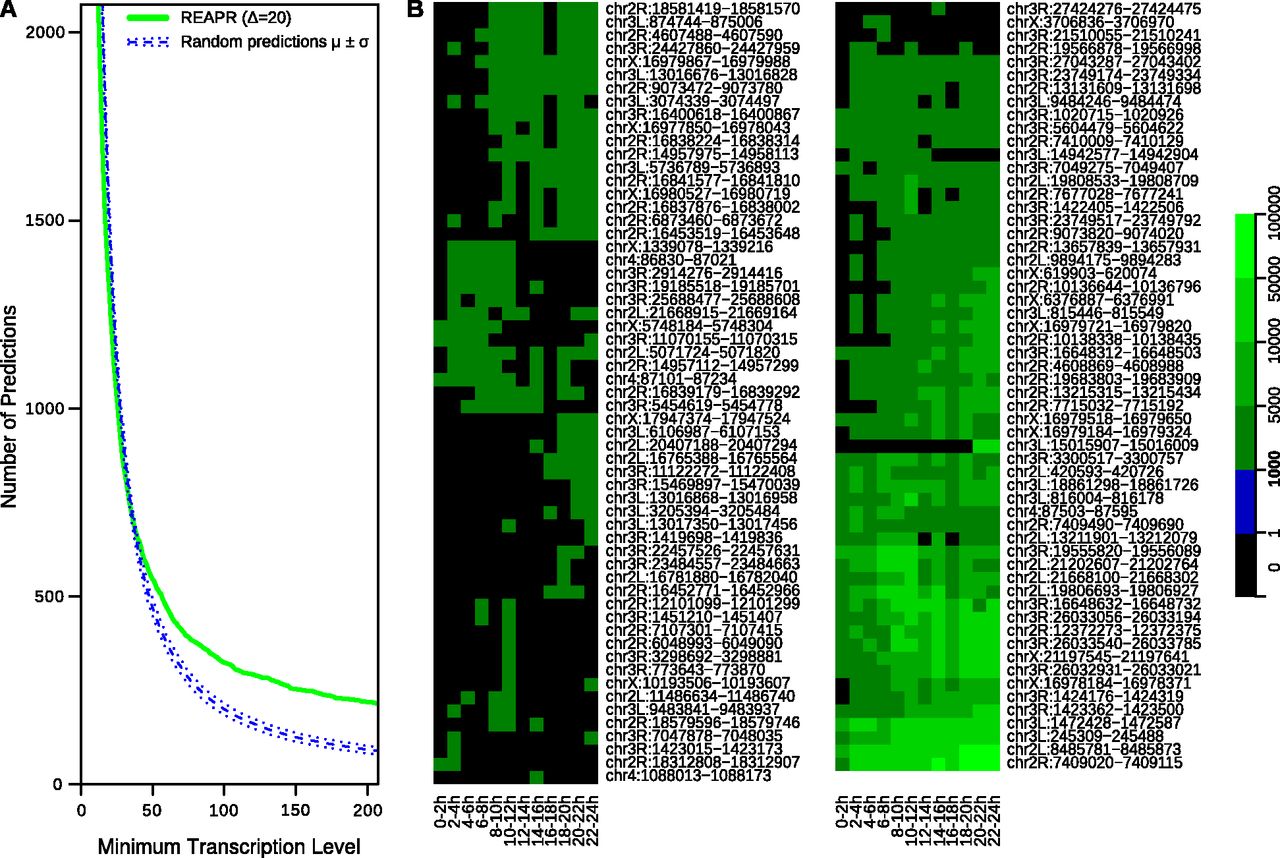
Transcription levels of novel predictions during D. melanogaster embryonic development. The level of each prediction was measured as the maximum number of RNA-seq reads overlapping the same position in a prediction. (A) The distribution of predictions as a function of the minimum transcription level. Levels were calculated using the reads from stage 20–22 h. We show high-confidence predictions from REAPR, Δ = 20 (green). Dashed blue lines represent the expected number of random predictions (μ) and the band of ±1 SD (σ). For example, there are 325 REAPR predictions, versus 200.6 (±15.2) random predictions on average, whose transcriptional levels are 100 reads or higher. (B) Transcription profiles of the 117 REAPR predictions whose levels are at least 1000 reads in at least one stage.


