
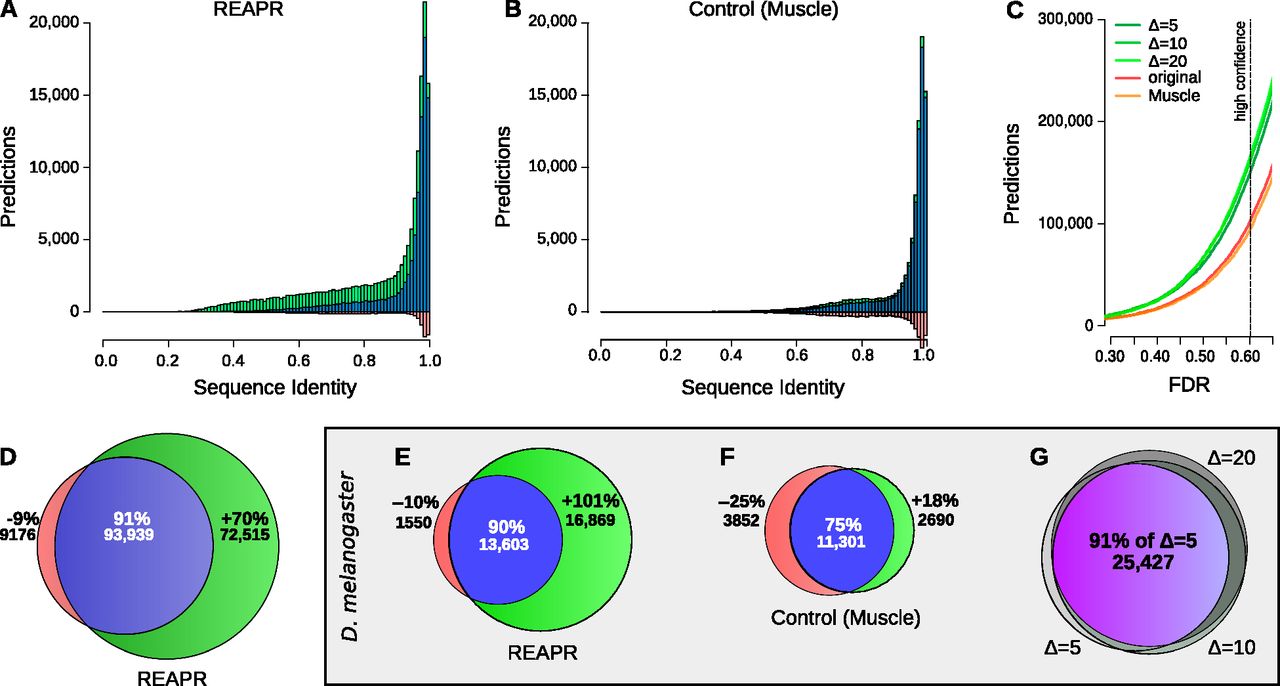
(A–D) High-confidence predictions in fly. Histogram of predictions by REAPR (Δ = 20) using structure-based realignment (A) or by a variant pipeline using purely sequence-based realignment as a function of average pairwise sequence identity (B). Predictions found after realignment (blue + green) are shown together with predictions found directly from the original WGA (blue + red). (C) Number of predictions in fly by REAPR (Δ = 5, 10, 20), the MUSCLE variant, and the original WGA as a function of the FDR set for these pipelines. Note how the MUSCLE curve almost coincides with the curve of predictions from the original WGA. (D) Venn diagram depicting the percentage gain and loss in predictions by REAPR relative to the number of predictions from the original WGA. There are many more novel predictions (green) by REAPR at lower sequence identities. (E–G) High-confidence predictions in D. melanogaster. Percentage gain and loss in predictions by REAPR (E) or by the MUSCLE variant (F) relative to the number of predictions from the original WGA. REAPR predicts roughly twice as many ncRNAs while the MUSCLE variant loses roughly as many predictions as it gains. (G) Overlap in predictions by REAPR under various deviation limits of Δ = 5, 10, 20. The mutual agreement is shown in purple. Predictions are robust to the deviation limit.


