
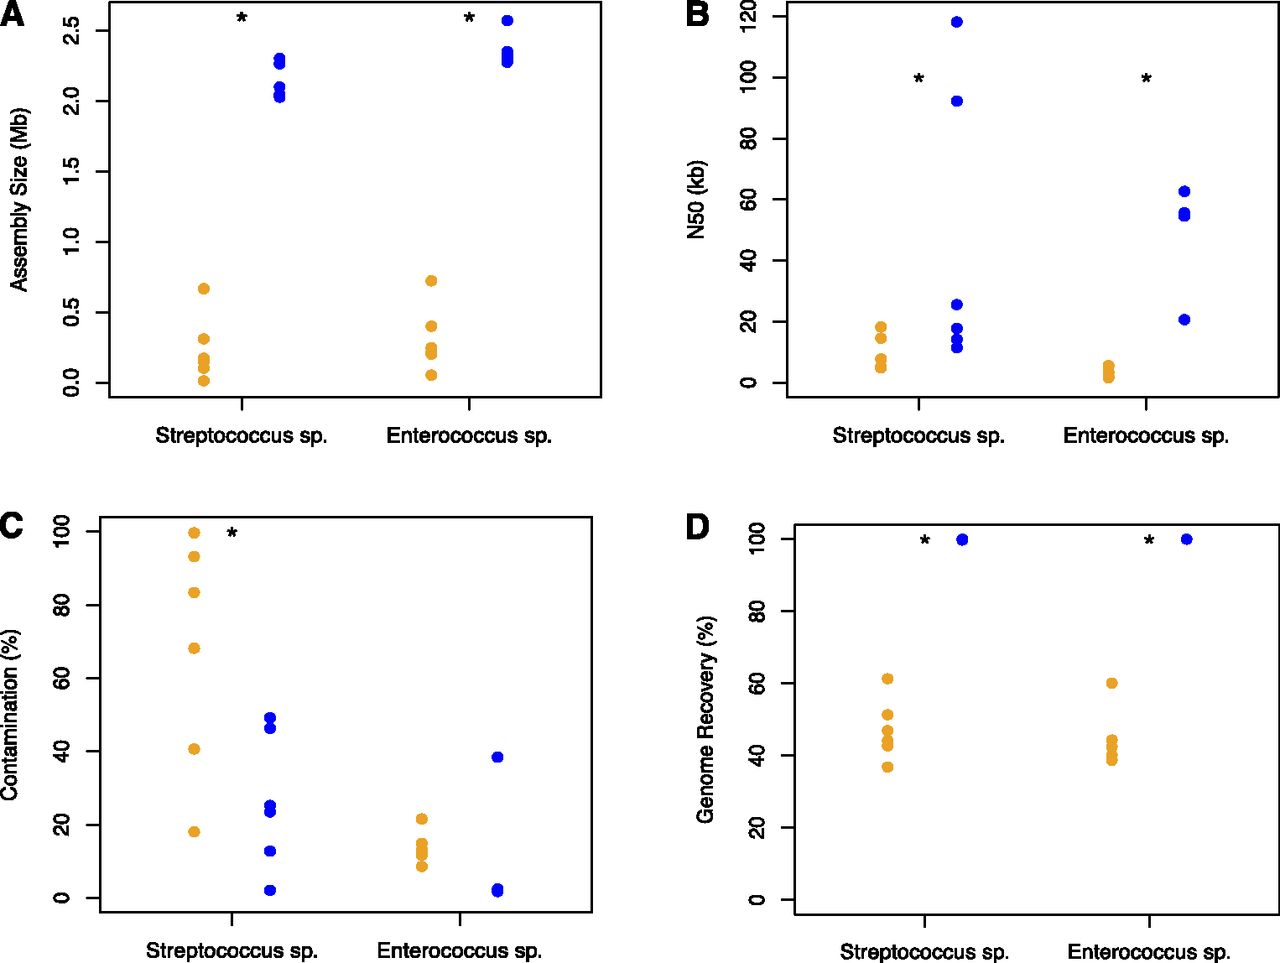
Figure 2.
Sequencing results of amplified single cells and GMDs. (Blue circles) GMDs; (orange circles) single cells. (A) Assembly size; (B) largest contig; (C) percent contamination. (D) Genome recovery as measured by mapped reads to the best GMD assembly. (*) Statistical significance for that comparison (P < 0.05).


