
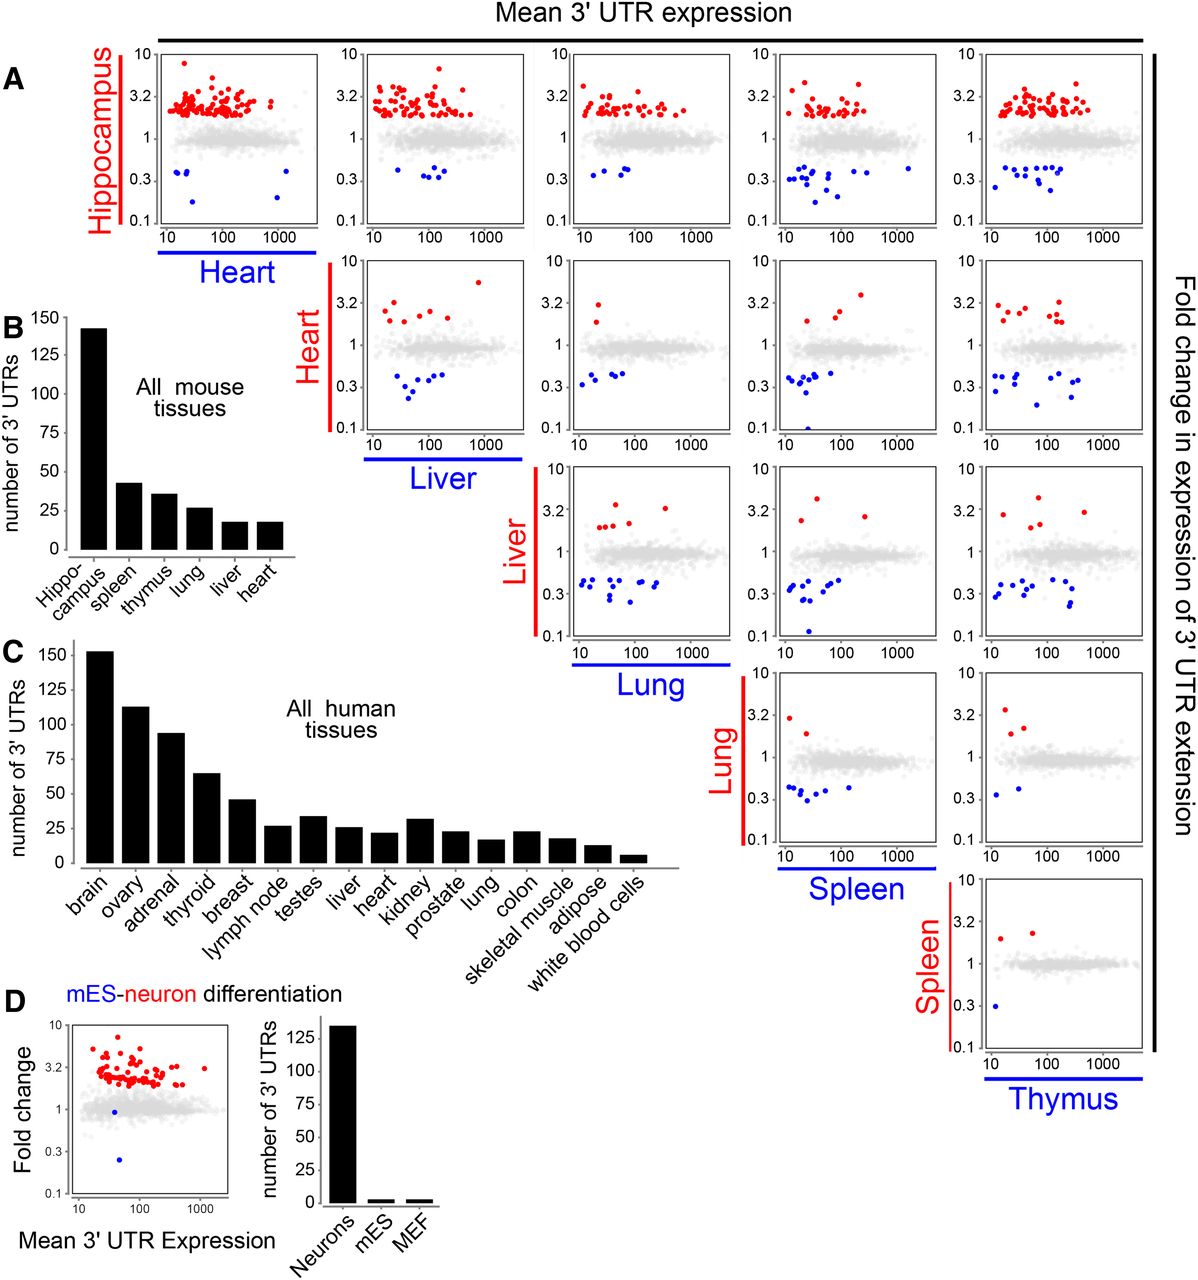
Systematic tissue comparisons show that 3′ UTR lengthening occurs preferentially in the brain. (A) Pairwise analysis of tissue-specific preferences of novel mouse 3′ UTR extensions using DEXSeq. Each gene is represented as a single point, such that the relative expression of the 3′ UTR extension between the pair of tissues (indicated at the left of each row and the bottom of each column) is plotted as the Y-coordinate, and the average expression of the 3′ UTR in that pair of tissues is plotted as the X-coordinate. For genes exhibiting a significant (greater than twofold, FDR < 0.01) difference between the two tissues the point is colored red if the relative usage is higher in the tissue indicated at the left of the row and blue if it was higher in the tissue indicated at the bottom of the column; all other 3′ UTRs are shown in gray. We observed a broad tissue-wide trend toward increased expression of lengthened 3′ UTRs in hippocampus, seen as a substantial excess of red points across the top row of tissue comparisons against hippocampus. No particular trend is observed among the other pairwise tissue comparisons. (B) Summary of the pairwise analysis of novel 3′ UTR extensions annotated in mouse. For each tissue, the set of genes that are detected by DEXSeq to have a higher fold expression of an extended 3′ UTR extension compared to at least one other tissue were counted. (C) Summary of DEXSeq tissue comparisons of novel 3′ UTR extensions in human (for all pairwise scatterplots, see also Supplemental Fig. 8). (D) DEXSeq analysis of our novel mouse 3′ UTR extensions, assessed in RNA-seq data from mES/neuron/MEF cells. In the scatterplot, mES data are in blue and differentiated neuron data are in red.


