
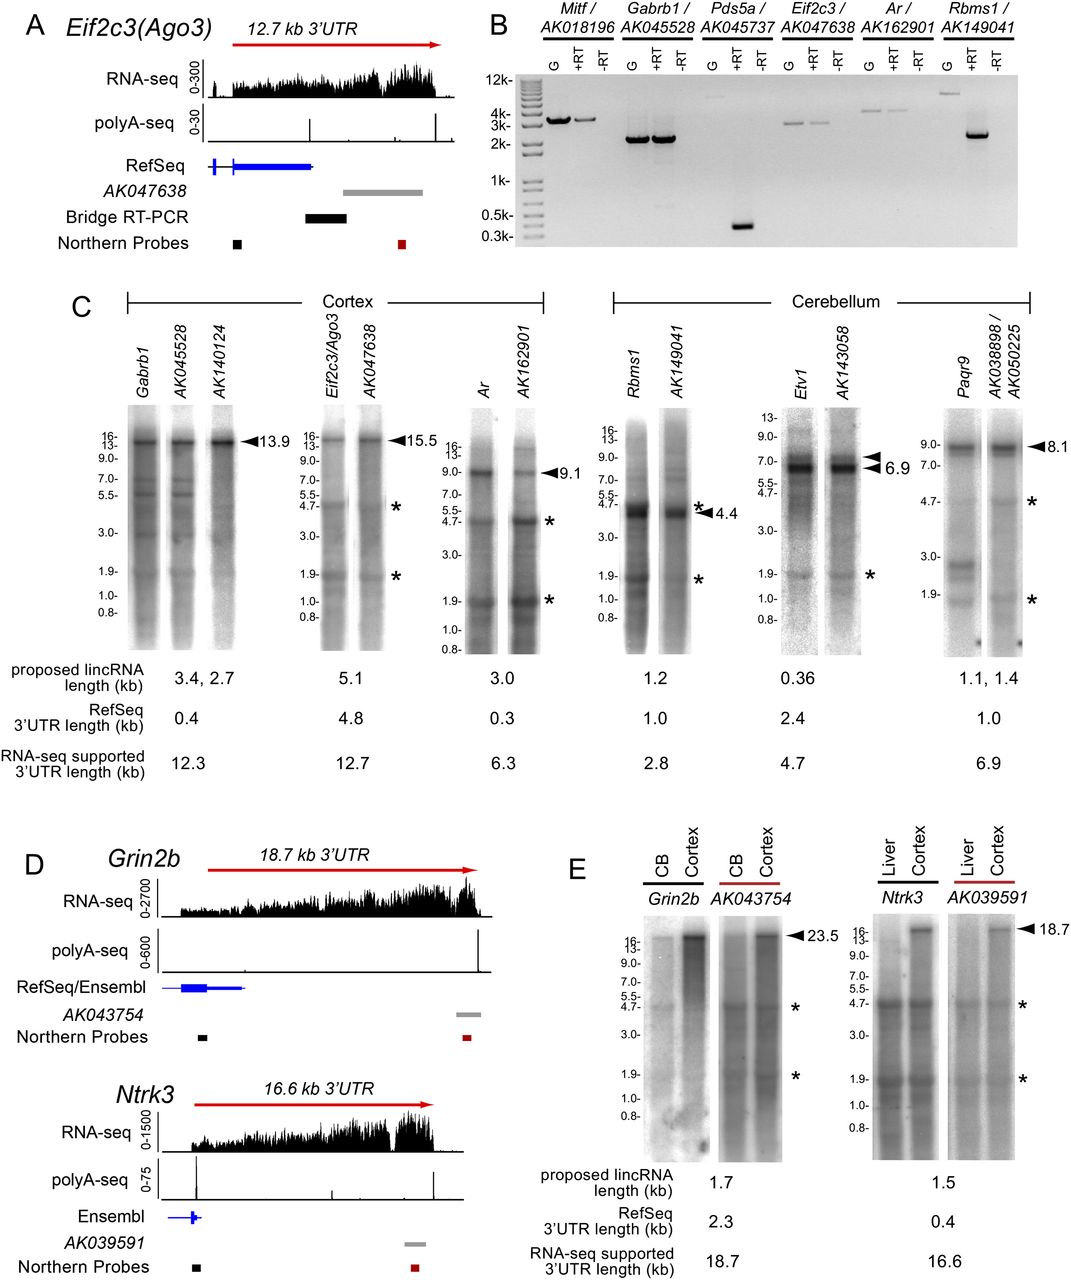
Evidence that annotated lincRNAs downstream from protein-coding gene pairs are 3′ UTR extensions. (A) Experimental strategy to test connectivity between a protein-coding gene and a downstream lincRNA. RNA-seq and polyA-seq evidence in the vicinity of eIF2C3 (also known as Ago3) and the proposed lincRNA AK047638. We designed primers to amplify bridge rt-PCR products and Northern probes, as shown. (B) Bridge rt-PCR using adult cerebral cortex RNA connects many protein-coding genes with their proposed downstream neighboring lincRNAs (Ponjavic et al. 2009); note Ar was previously referred to as Adr, and Ube2k was termed Hip2. Note that AK045737 was proposed to be a pair with Ube2k (Ponjavic et al. 2009); however, stranded RNA-seq data revealed that AK045737 is continuous with a spliced exon of Pds5a transcribed from the other strand (see Supplemental Figure S1A–C). (C) Northern analysis demonstrates that the predominant transcripts detected by probes for the protein-coding loci assayed in B are codetected by probes against their neighboring downstream lincRNAs. Conversely, we did not detect stable transcripts corresponding to the sizes of the annotated lincRNAs. Northern blots are also shown for ncRNAs described by Mattick and colleagues (Clark et al. 2012) and their protein-coding pairs Etv1 and Paqr9. (D) RNA-seq and PolyA-Seq tracks for cases of annotated lincRNAs that appear to be contained with exceptionally long, continuous 3′ UTRs of stable mRNAs. (E) Northern blots for proposed lincRNAs show a band of exceptional length that is of the same molecular weight as the bands identified by probes corresponding to the upstream protein-coding transcripts. Arrowheads identify dominant bands that correspond to size estimates based on RNA-seq data. Note that the sizes of the bands on the Northern blot are consistent with the RNA-seq evidence–based size estimates. Asterisks denote 28S and 18S ribosomal bands corresponding to 4.7 kb and 1.9 kb, respectively. Ladder information can be found in Supplemental Figure S4. For RNA-seq tracks, probe locations, and gene annotations, see Supplemental Figure S1D.


