
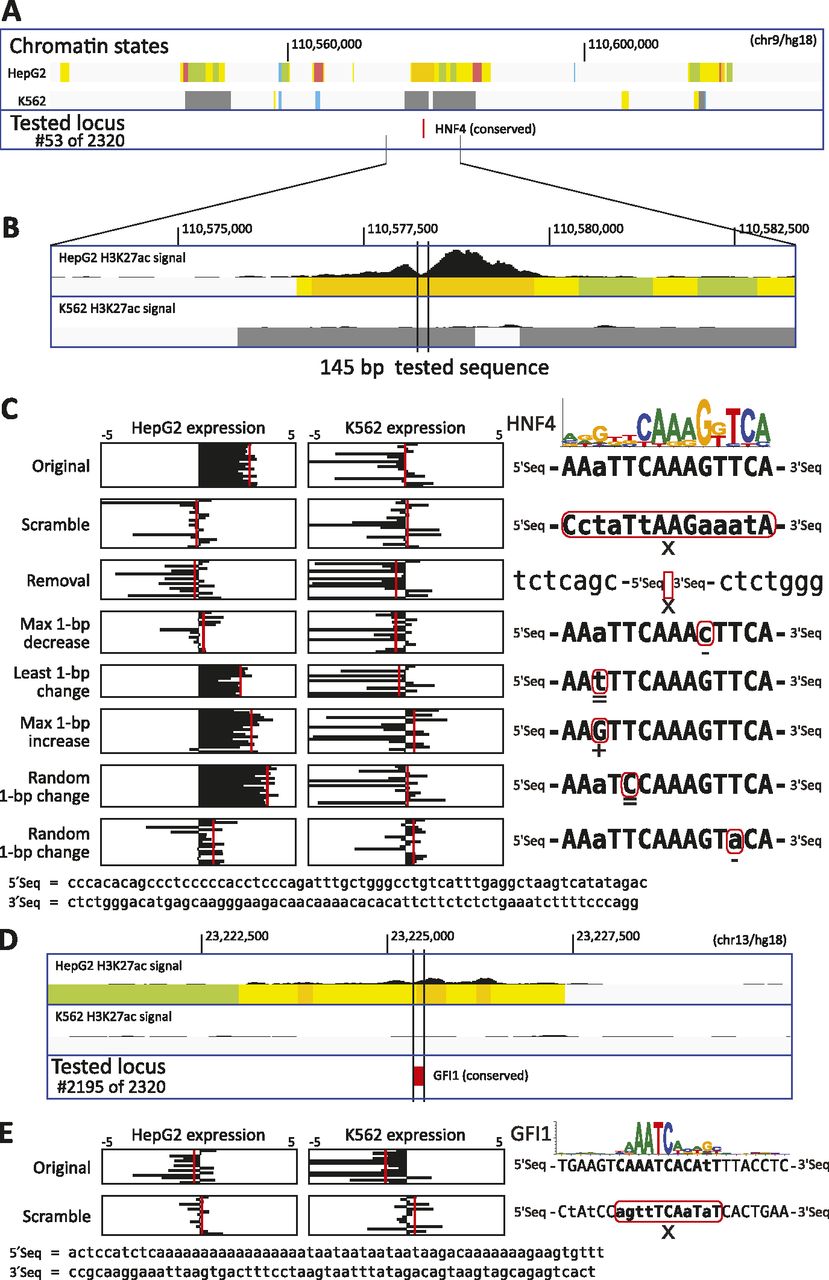
Example activator and repressor motif manipulations (for all tested, see Supplemental Data S1). (A) HepG2 enhancer centered on a HNF4 motif (#53). Chromatin state tracks (Ernst et al. 2011) indicate promoters (red), poised promoters (purple), strong/weak enhancers (orange/yellow), insulators (blue), transcribed (green), repressed (gray), and low-signal/repetitive (light gray) regions. (B) The H3K27ac signal in HepG2 shows a dip on the HNF4 motif, consistent with nucleosome exclusion due to TF binding. (C) The original sequence shows expression (replicates in black, mean in red) in HepG2 but not K562, confirming the predicted cell-type specificity. Motif disruptions (scramble, removal, max 1-bp decrease, and the second random) eliminate HepG2 expression, while neutral and motif-improving changes do not, supporting the PWM model. The positions matching the motif consensus are indicated in uppercase. (D) HepG2 enhancer centered on a GFI1 instance (#2195), predicted to be repressed in K562 where GFI1 is active. (E) Expression for the original sequence in K562 is below baseline, confirming repression. Upon scrambling the motif, aberrant expression is seen in K562, where GFI1 is predicted to be a repressor, while no change is seen in HepG2.


