
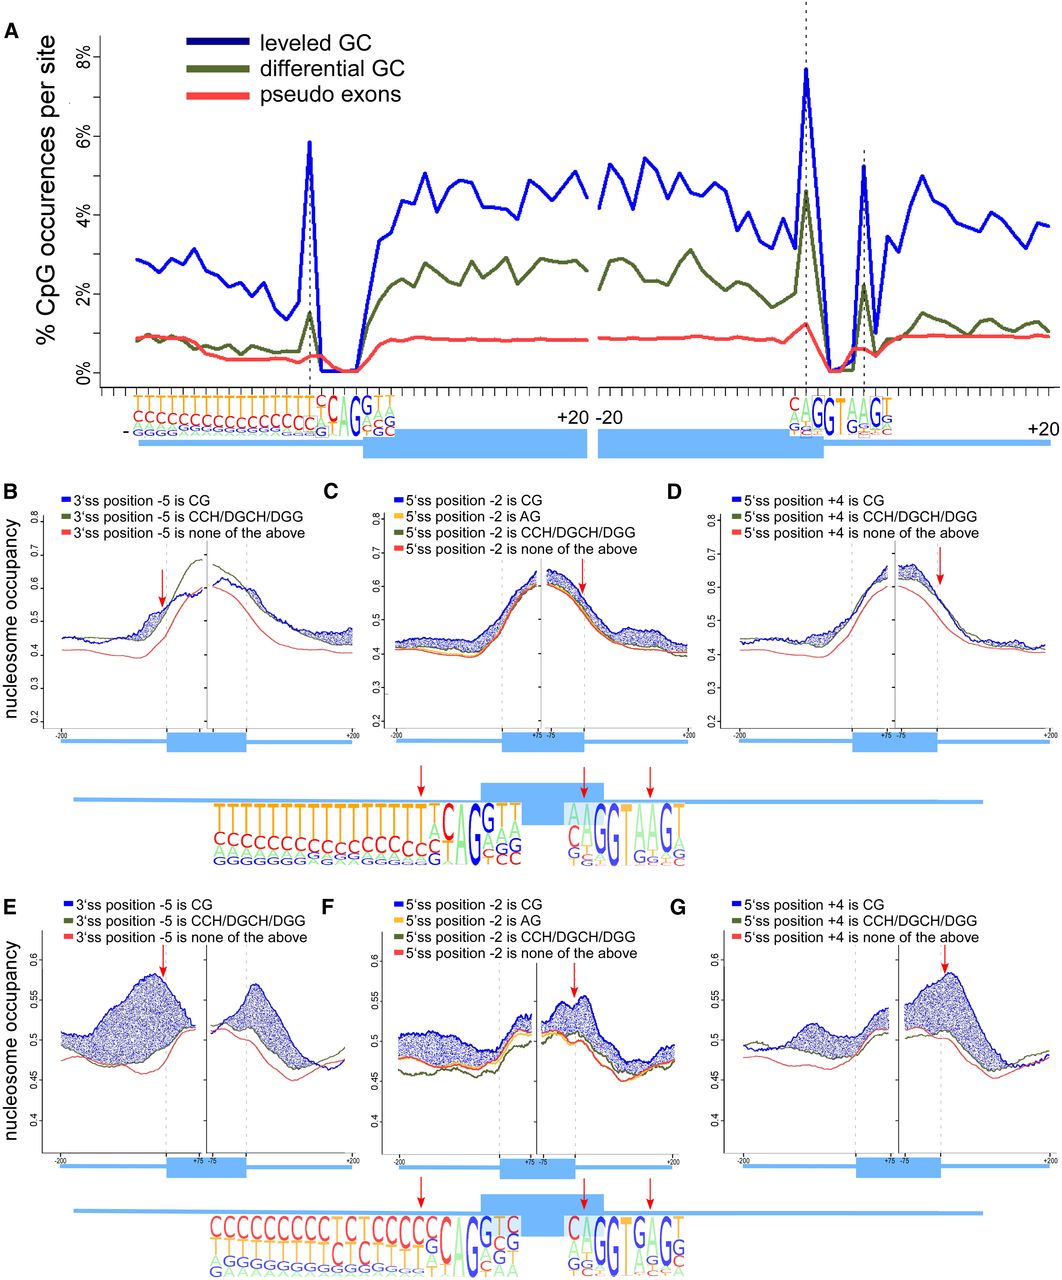
CpG-abundance peaks at splice sites and their effect on nucleosome occupancy. (A) Percentage of methylated CpGs around the 3′ and 5′ splice sites of the differential GC exon–intron group (green), leveled GC content exon–intron group (blue), and pseudo exons (red). The percentage was calculated per base for exons (20 nt from each splice site) and flanking intronic regions (20 nt), and the number of exons with a CpG at each position was divided by total exons. The structure of the exon–intron junctions are shown in the bottom with pictogram depictions of the splice sites based on Gelfman et al. (2012). Specific positions with high levels of DNA methylation are marked in black boxes and dashed lines. (B–D) Average per base nucleosome occupancy levels for differential GC exons. Nucleosome occupancy levels are presented for three positions within the splice sites: (B) position −5 of the 3′ splice site; (C) position −2 of the 5′ splice site; and (D) position +4 of the 5′ splice site. Nucleosome occupancy levels are given based on dinucleotide composition: (1) CG dinucleotides (blue); (2) CCH/DGCH/DGG (green); and (3) any other composition (red). Position −2 of the 5′ splice site is compared to the AG dinucleotide composition, which represents the consensus dinucleotide at this position. Structure of the differential GC exon–intron junctions are shown in the bottom of these panels with pictogram depictions of the splice sites. (E–G) Average per base nucleosome occupancy levels for leveled GC exons. Nucleosome occupancy levels are presented for three positions within the splice sites: (E) position −5 of the 3′ splice site; (F) position −2 of the 5′ splice site; and (G) position +4 of the 5′ splice site. Structure of the leveled GC exon–intron junctions are shown in the bottom of these panels with pictogram depictions of the splice sites.


