
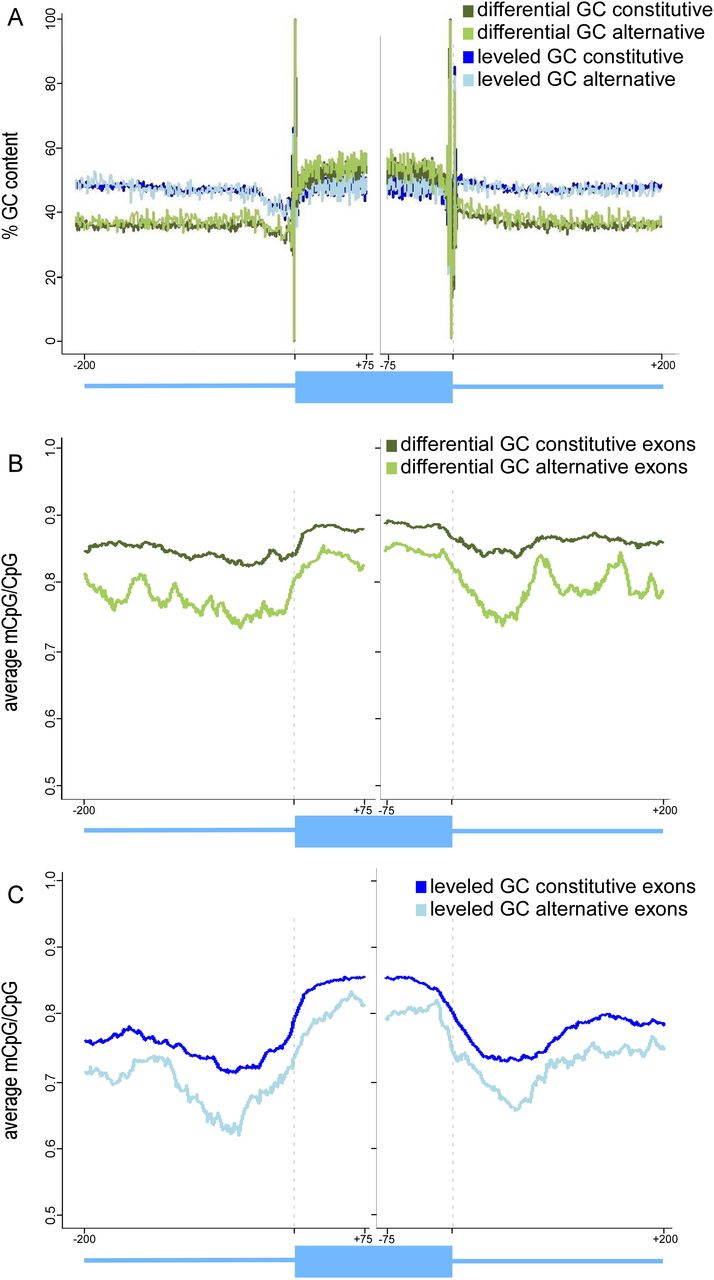
Average of methylated CpGs and GC content of constitutive and alternative exons. (A) Average of GC content percentage of differential GC content constitutive exons (dark green) and alternative exons (bright green) and of leveled GC content constitutive exons (dark blue) and alternative exons (bright blue). (B) Average of methylated CpGs of differential GC content constitutive exons (dark green) and alternative exons (bright green). (C) Average of methylated CpGs for leveled GC content constitutive exons (dark blue) and alternative exons (bright blue). The average value was calculated per base for exons (75 nt from each splice site) and flanking intronic regions (200 nt). A running average of 20 was applied for mCpG values after omitting the following positions for having no CpG occurrences: 3′ splice site positions −4 to −1 and 5′ splice site positions +1 and +2.


