
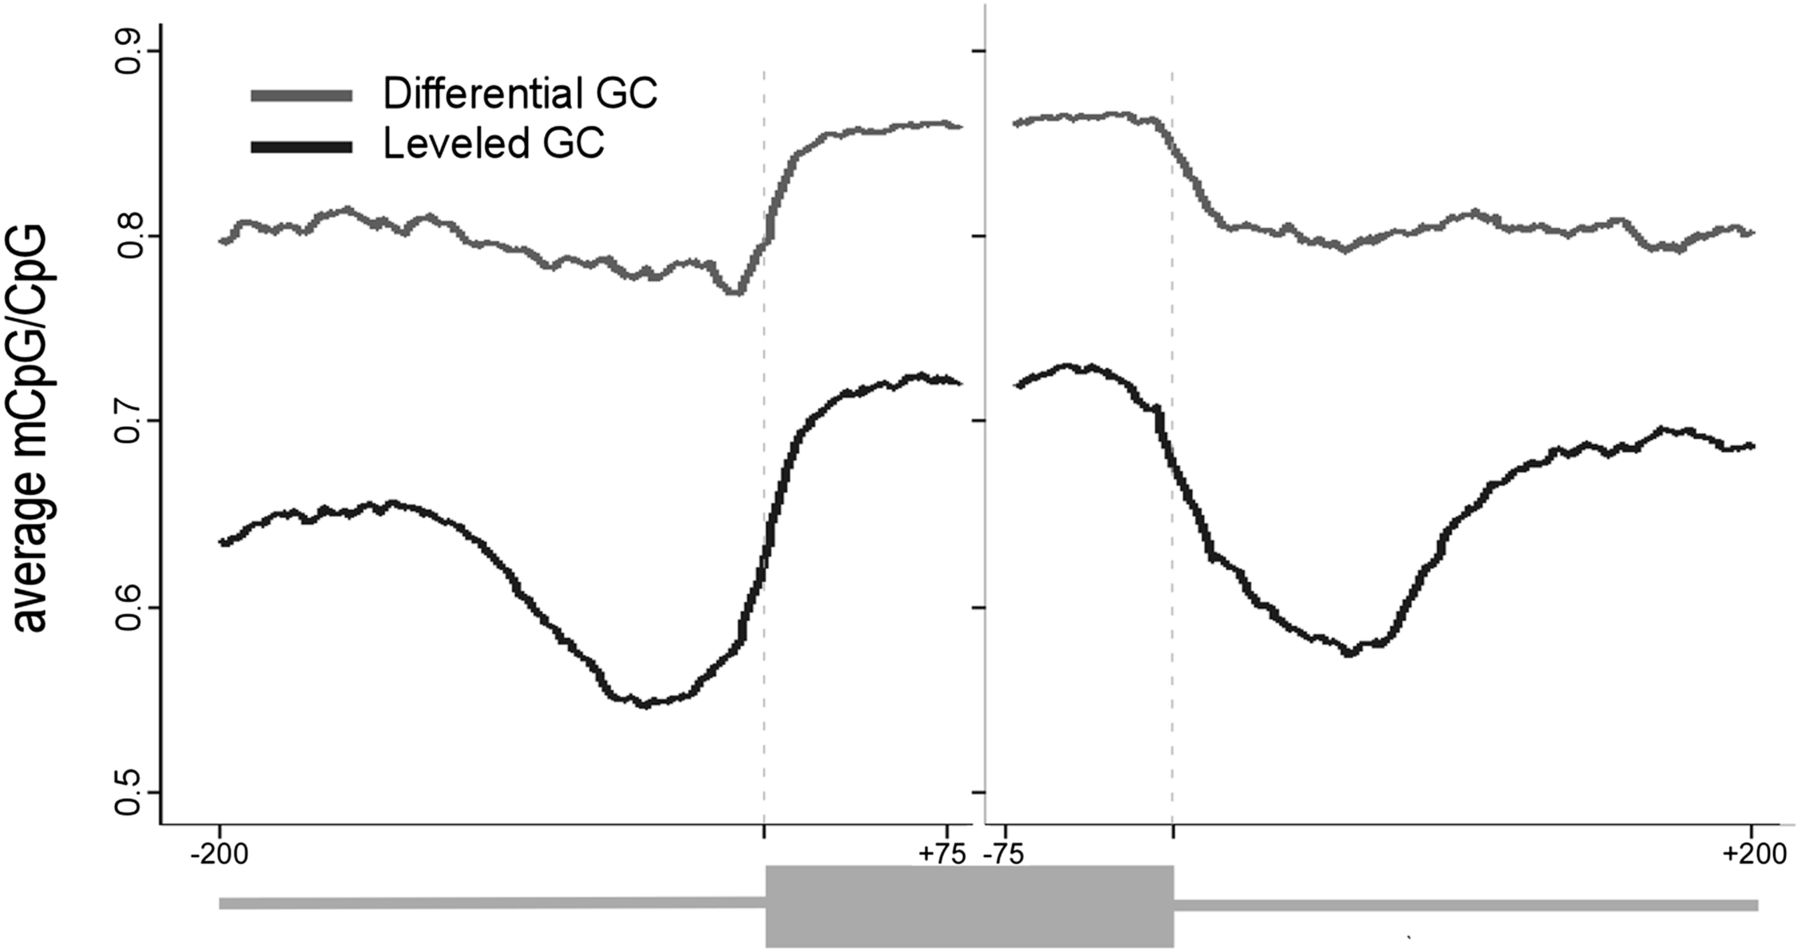
Figure 1.
DNA-methylation levels in exons and flanking introns that differ by their GC content. Average of methylated CpGs along exon–intron structure with a differential GC content between the intron and the exon (gray) and along exon–intron structure in which the GC content is identical between the exon and the flanking introns (black). The average value was calculated per base for exons (75 nt from each splice site) and flanking intronic regions (200 nt). A running average of 20 was applied after omitting the following positions for having no CpG occurrences: 3′ss positions −4 to −1 and 5′ss positions +1 and +2.


