
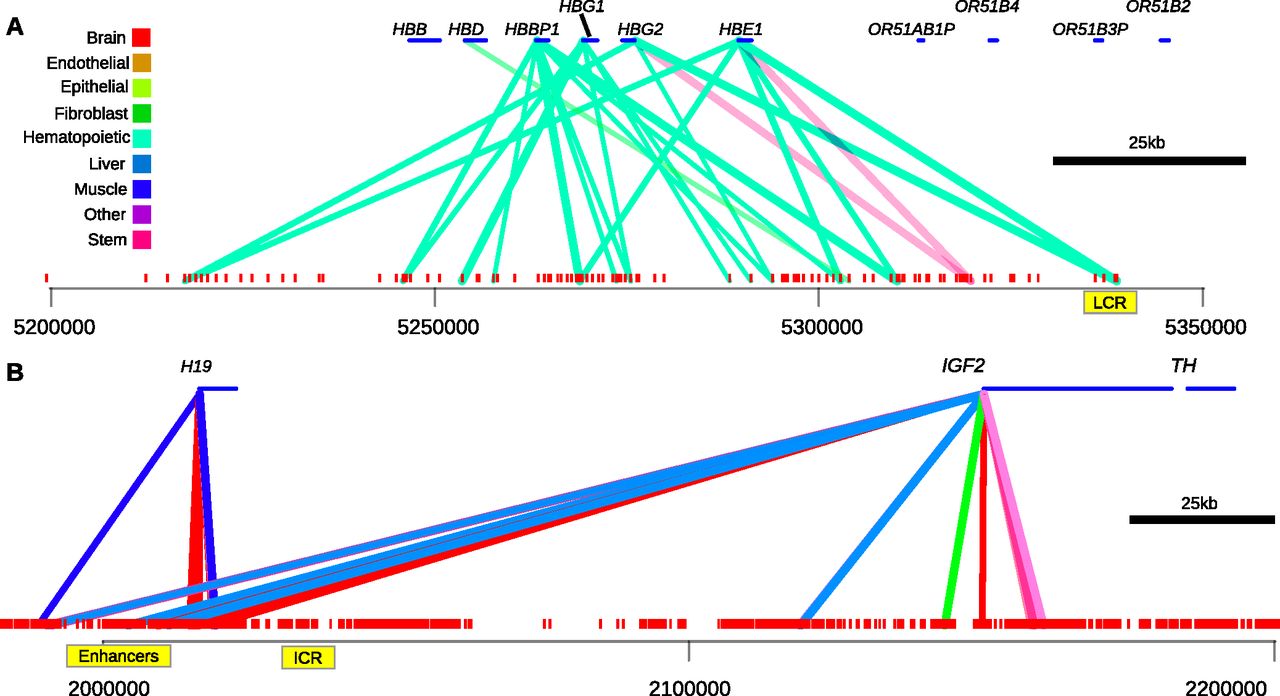
Figure 7.
Correlation between DHS and expression. (A) Tie-plot showing the top 50 connections at the beta-globin locus, color coded by tissue type. Red marks below indicate DHSs. Blue bars above represent genes. Connecting lines represent significant correlations, where the width of the lines is proportional to the correlation strength. To simplify the illustration, connections to the olfactory receptors have been removed (see Supplemental Material). (B) Tie-plot for the H19/IGF2 locus (see also Supplemental Fig. S4D).


