
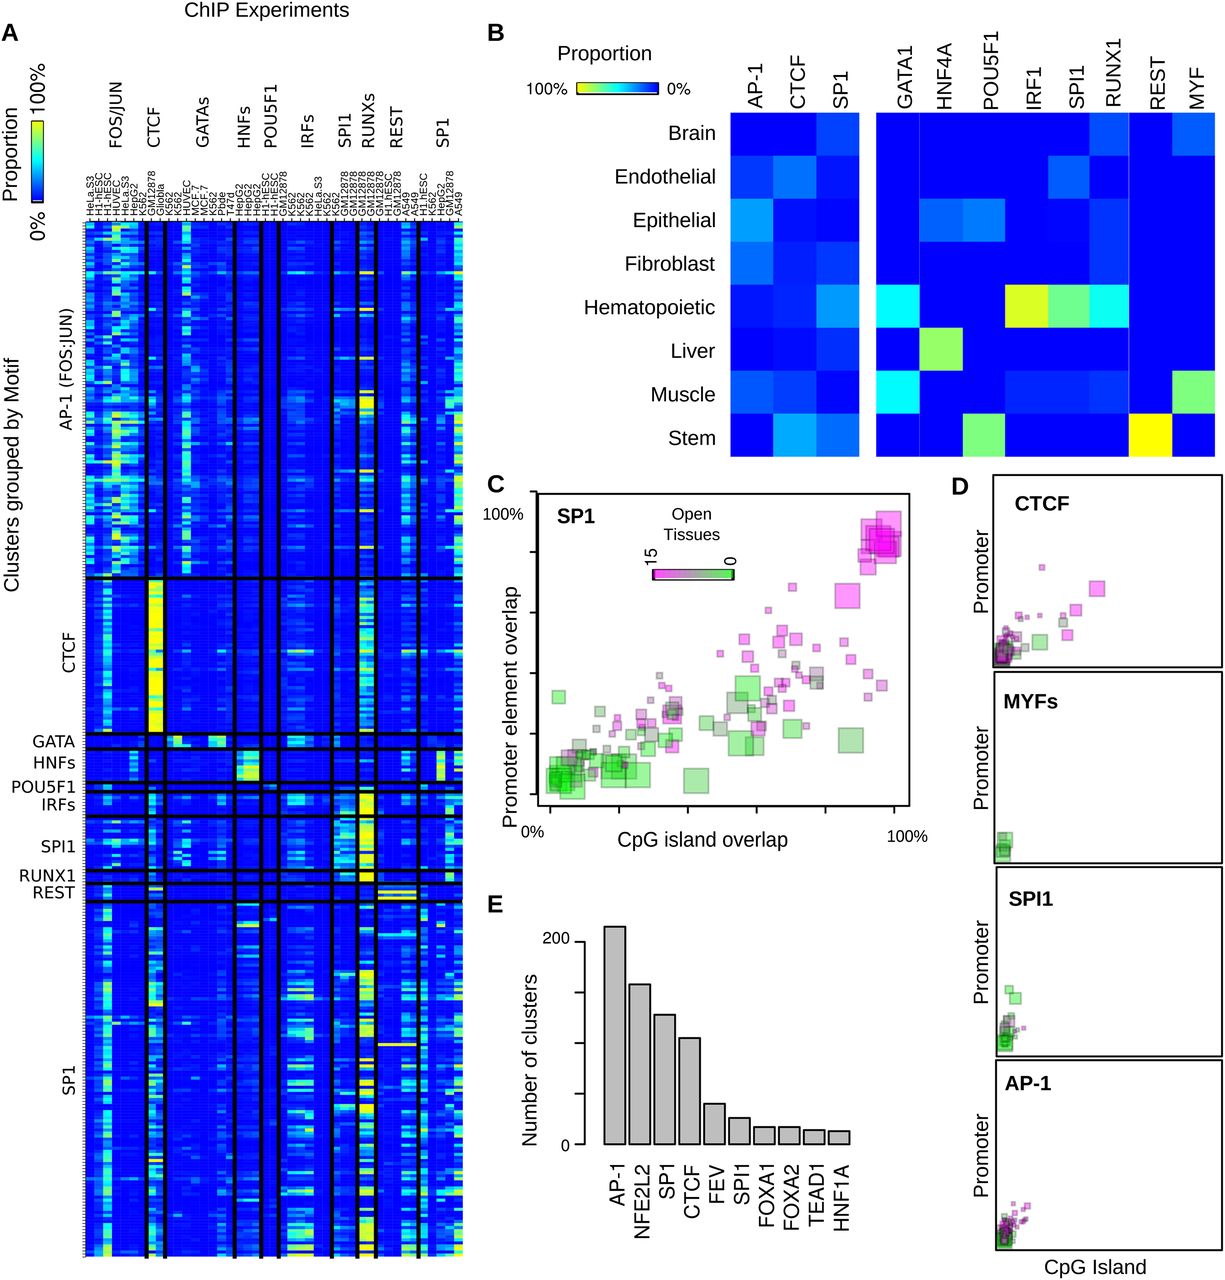
Motif specificity in SOM clusters. (A) Concordance ([yellow] high, [blue] low) between ChIP results (x-axis) and motif discovery in DNase I clusters (y-axis). (B) The cell-type specificity for selected motifs. This heatmap shows the distribution of most-open tissues for each motif. For example, 100% of the clusters where the POU5F1 motif was found had stem cells (Stem) as the most open tissue type, whereas MYF family motifs were found predominantly in muscle clusters. (C,D) Each colored square represents a cluster with enrichment for the given motif. (x-axis) overlap with CpG islands; (y-axis) overlap with promoters; (color) the number of tissues with at least one sample above a cutoff. Each factor shown here has a different distribution of cell-type specificity and promoter/CpG-island overlap. The size of a square indicates the number of DHSs in the cluster. (E) Number of clusters that are enriched for the most common motifs.


