
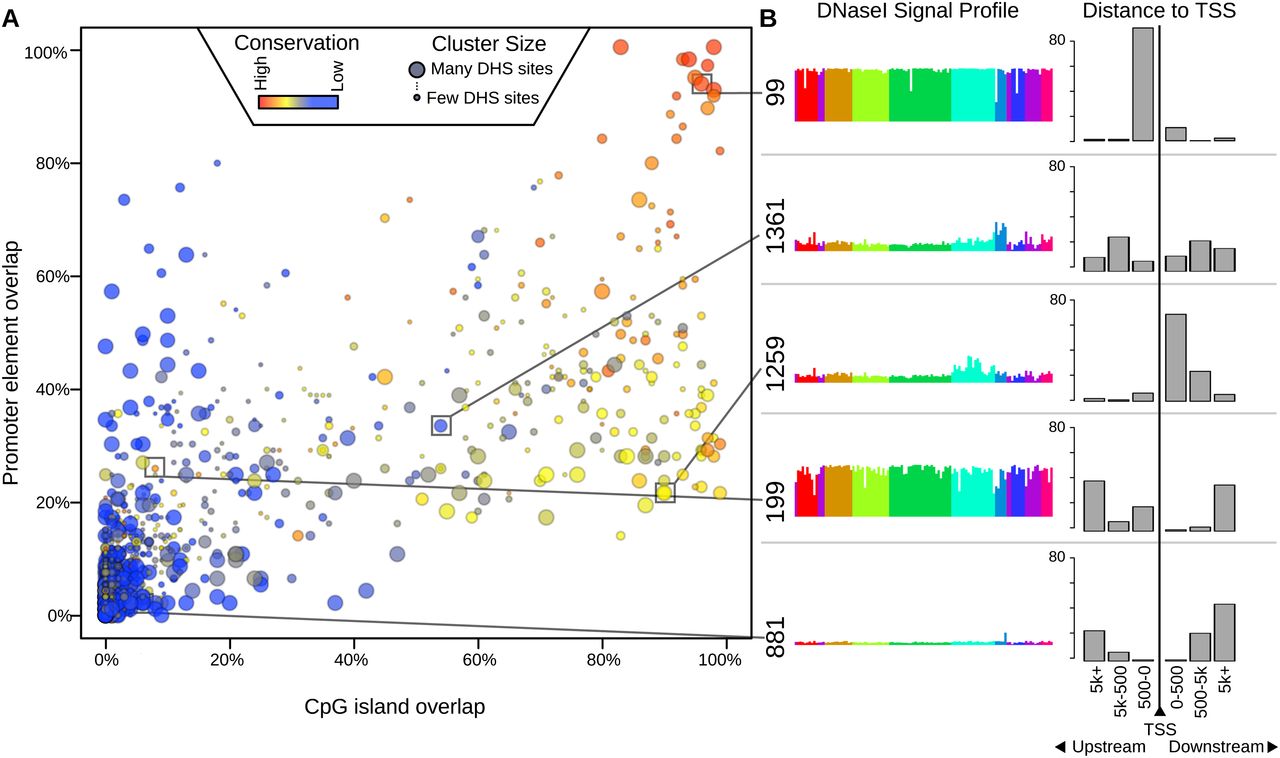
Distribution of conservation, promoters, and CpG islands across clusters. (A) Each cluster is plotted as a bubble. The x-axis indicates the percent of the top 100 DHSs in that cluster (ranked by nearness to the cluster center) that overlap a CpG island; the y-axis indicates the percent that overlap a promoter; color indicates the percent that overlap a phastCons conserved element (Siepel et al. 2005). The size of the bubble indicates the number of DHSs belonging to the cluster. (Red bubbles in the upper-right corner) Clusters capturing primarily highly conserved, CpG-rich promoter elements. (B) DNase I signal profiles of five example clusters, showing the distribution of distance to the transcription start site (TSS) of the nearest gene. Cluster 99 is promoter rich; cluster 1259 is preferentially located in an early intron; cluster 199 is highly conserved, but not associated with promoters or CpG islands; cluster 881 is primarily distal, with no regions within 500 bp of a TSS (see also Supplemental Fig. S2).


