
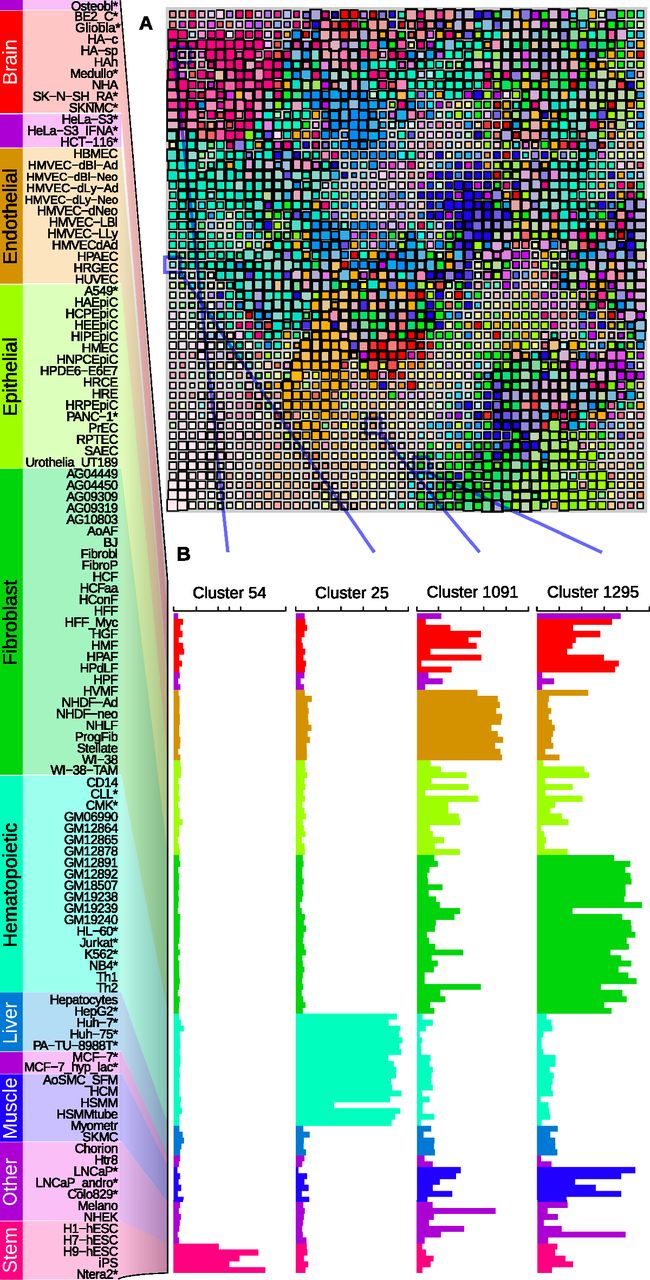
Figure 1.
SOM clustering of DHS profiles. (A) A 50 × 50 self-organizing map (SOM). Each box represents a cluster of DHSs with similar DNase-seq signal profiles across samples, color-coded by tissue (legend, left). Cluster color corresponds to the combination of cell types in which the associated DHSs have high signal in the detailed profile. Square size indicates the number of DHSs assigned. (B) Average DHS profiles across samples for four individual clusters. Clusters contain sites open in highly related cell types (54 and 25) and less related cell types (1091 and 1295). (*) Malignant samples.


