
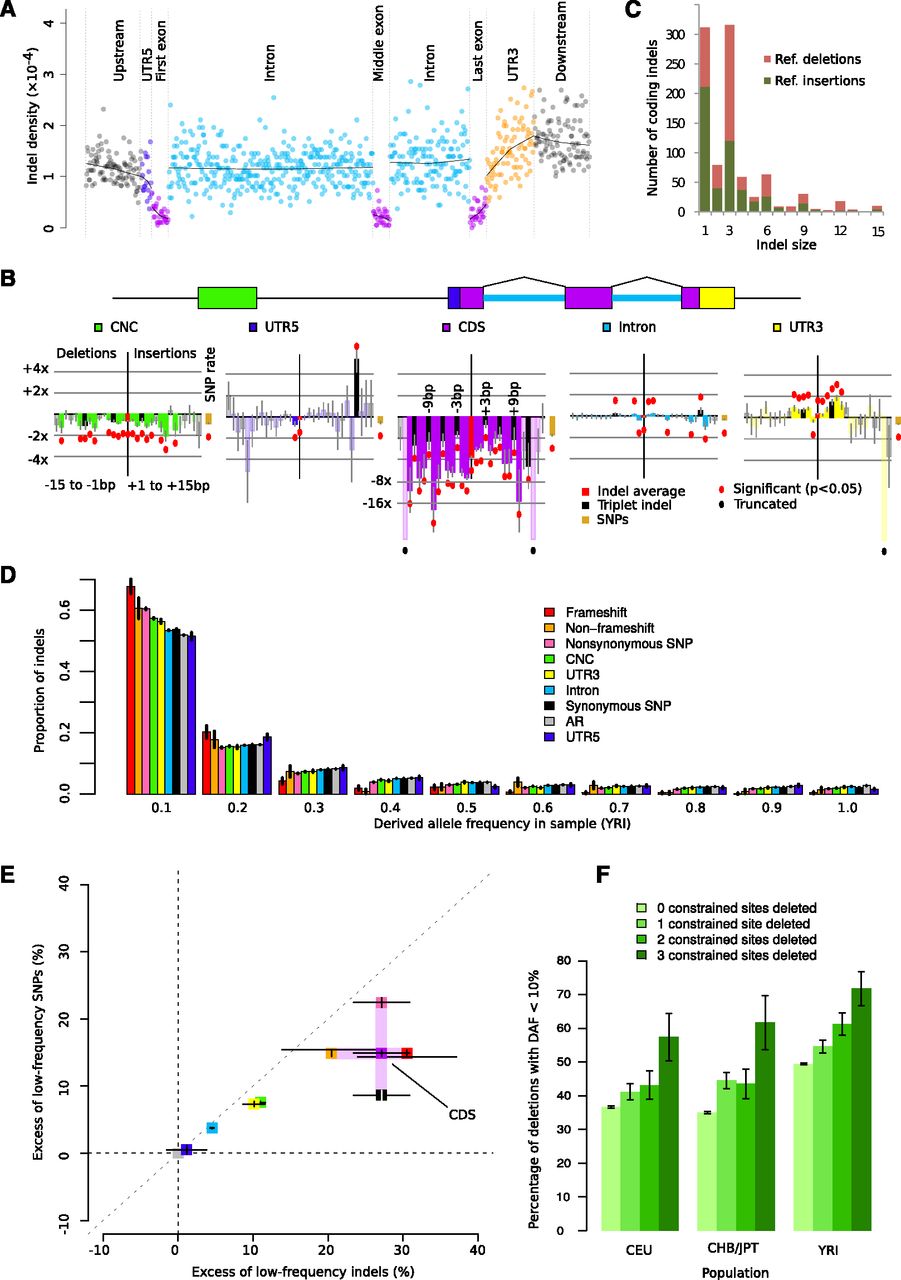
Purifying selection against indels in functional regions. (A) Aggregate indel density (the sum of all indels in a set of bins divided by the total length of those bins) in six genic regions (GENCODE version 3b). (B) Relative indel rates by length (negative x-axis, deletions; positive x-axis, insertions) and annotation (color-coded), controlling for background rates influenced by sequence composition. Bars represent log relative excess or depletion compared to the background rate; red dots mark bars that are significant at the 5% level, not corrected for multiple testing. (C) Histogram of coding indel lengths; colors indicate (unpolarized, reference) deletions and insertions. (D) Derived allele frequency (DAF) distribution of deletions by annotation category. (E) Relative excess of low-DAF (<10%) indels and SNPs by annotation class, calculated as (Ni – Nn)/Nn × 100%, where Ni is the fraction of low-DAF variants in element i, and Nn is the fraction of low-DAF variants in ancestral repeats. (F) Fraction of low-DAF (<10%) 3-bp deletions by number of constrained sites deleted (χ2 P < 5 × 10⁻³ in all populations). All error bars (B,D,E,F) represent 1 SEM.


