
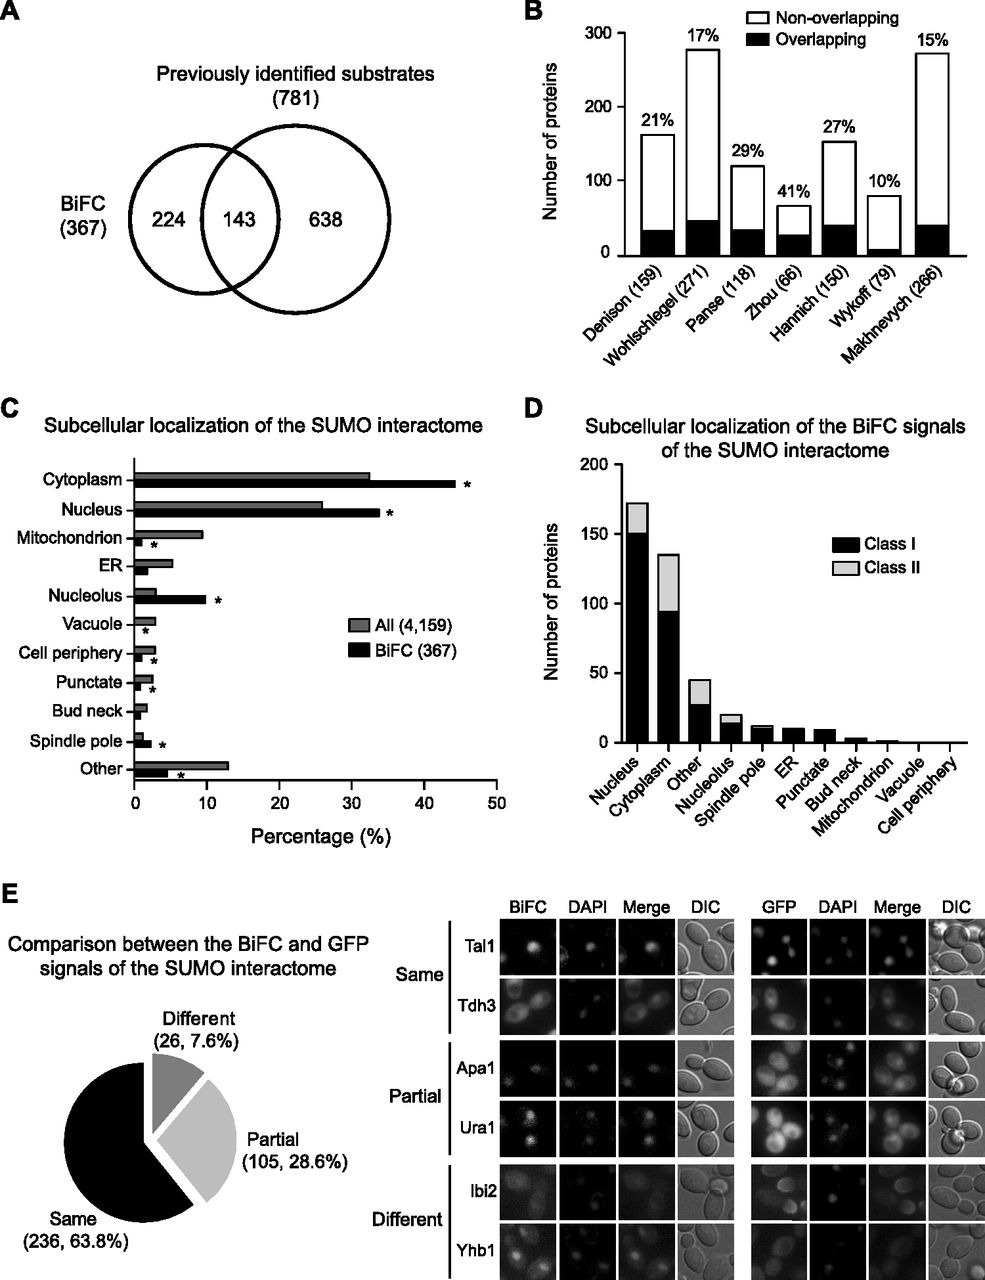
Characterization of the SUMO interactome. (A) Venn diagram depicting the comparison of the SUMO substrates identified in this study and those identified in seven previous analyses. (B) Bar graph depicting the comparison between the SUMO interactome and each of the seven previous data sets. The black and white bars indicate the number of SUMO substrates that overlap and do not overlap, respectively, with the data set in this study. The percentage of concordance between data sets is indicated above the bars. Numbers in parentheses indicate the number of SUMO substrates identified in each study. (C) Percentage of total hits for each subcellular localization of the SUMO substrates from the two data sets (All and BiFC). (All) Whole proteins for which subcellular localization has been annotated in the yeast GFP fusion localization database (http://yeastgfp.yeastgenome.org). (BiFC) SUMO interactome identified in this study. (Asterisks) Significant difference compared with All (P < 0.05; two-sided Fisher's exact test). (D) The number of hits for each subcellular localization of the BiFC signals. The black and gray bars indicate the number of substrates belonging to class I and class II, respectively. (E) (Left panel) Venn diagram depicting the comparison between the BiFC signal and GFP signal of each protein in the SUMO interactome. (Right panel) Fluorescence images of Tal1 and Tdh3, Apa1 and Ura1, and Ibi2 and Yhb1, which exhibit the same, partial, and different localization, respectively, between the BiFC and GFP signals.


