
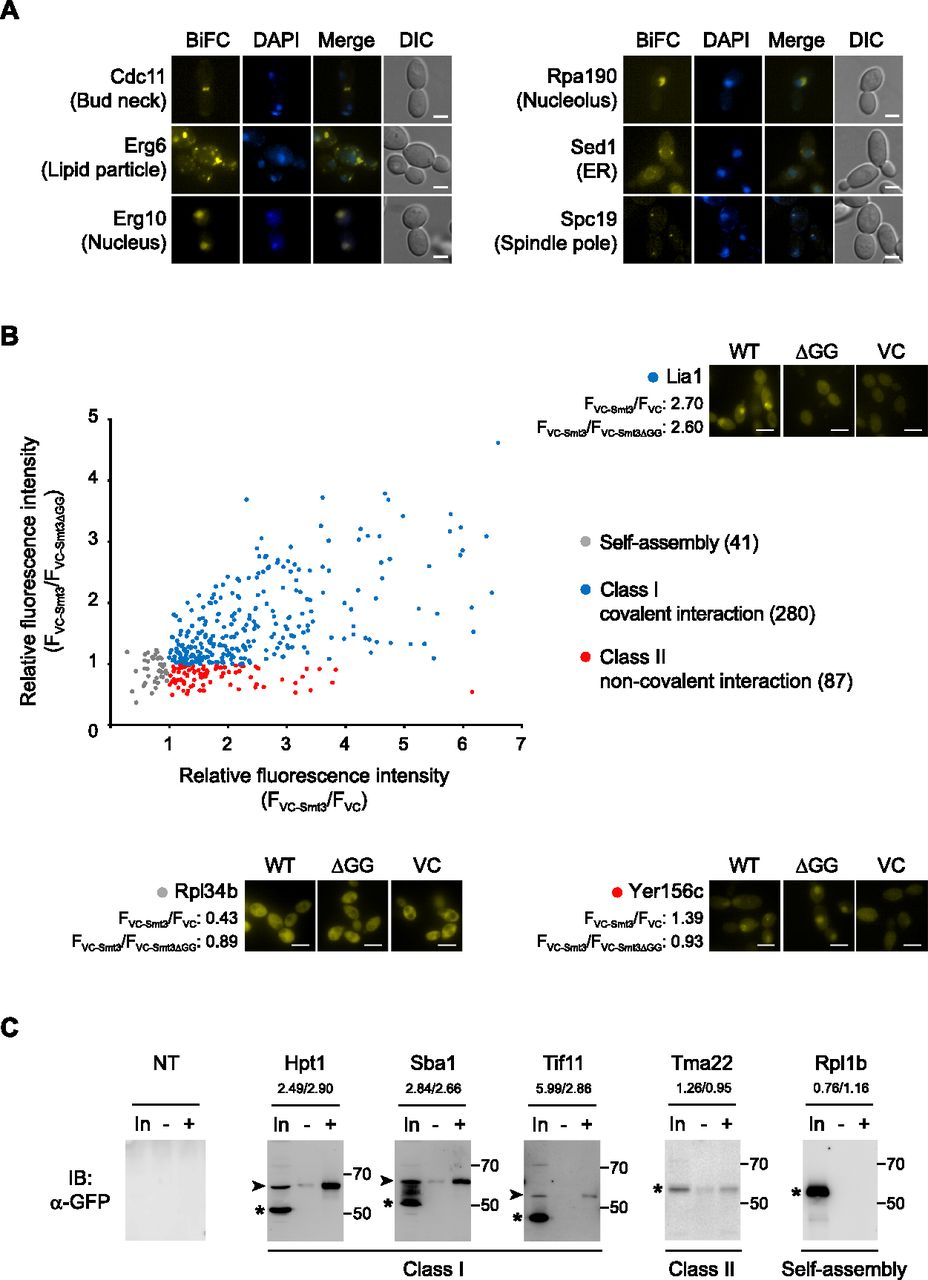
The SUMO interactome identified in this study. (A) Representative BiFC images showing in vivo SUMO interaction with diverse subcellular localizations. Fluorescence images are of the representative candidate proteins Cdc11, Erg6, Erg10, Rpa190, Sed1, and Spc19 for the bud neck, lipid particle, nucleus, nucleolus, ER, and spindle pole, respectively. Scale bars, 2 μm. (B) Identification and classification of the SUMO interactome. A total of 408 BiFC-positive proteins were analyzed by comparing the fluorescence intensity of cells expressing the VC fragment alone (FVC) or the VC-tagged nonconjugatable Smt3 (FVC-Smt3ΔGG) with that of cells expressing the VC-tagged wild-type Smt3 (FVC-Smt3). The relative BiFC intensity of FVC-Smt3/FVC and FVC-Smt3/FVC-Smt3ΔGG is shown at the x and y axes, respectively. Fluorescence images are of the representative candidate proteins Rpl34b, Lia1, and Yer156c for self-assembly, class I, and class II, respectively. WT, ΔGG, and VC in the diagram indicate the representative BiFC image obtained from each analysis with the VC-tagged wild-type Smt3, the VC-tagged nonconjugatable Smt3, and the VC fragment alone, respectively. For the quantification of the BiFC signals, the mean fluorescence intensity of 20 cells for each strain was measured with custom software written in MATLAB (Mathworks). Scale bars, 5 μm. (C) Immunoprecipitation to validate the BiFC results. For simplicity, the results for representative proteins of the three groups (class I, class II, and self-assembly) are shown. Yeast strains expressing the GFP tag at the C terminus of the corresponding proteins (Hpt1, Sba1, Tif11, Tma22, and Rpl1b) were grown to mid-log phase in YPD medium at 30°C. Total proteins were extracted, and the fraction immunoprecipitated with or without an anti-Smt3 antibody was probed with an anti-GFP antibody. The numbers on each panel indicate the FVC-Smt3/FVC and FVC-Smt3/FVC-Smt3ΔGG values for each protein. The positions of the molecular weight markers are indicated in kDas on the right of each panel. Arrowheads and asterisks indicate SUMO-modified and native protein bands, respectively. (NT) Nontagged cell, (In) total protein lysate, (−) immunoprecipitation without anti-Smt3 antibody, (+) immunoprecipitation with anti-Smt3 antibody.


