
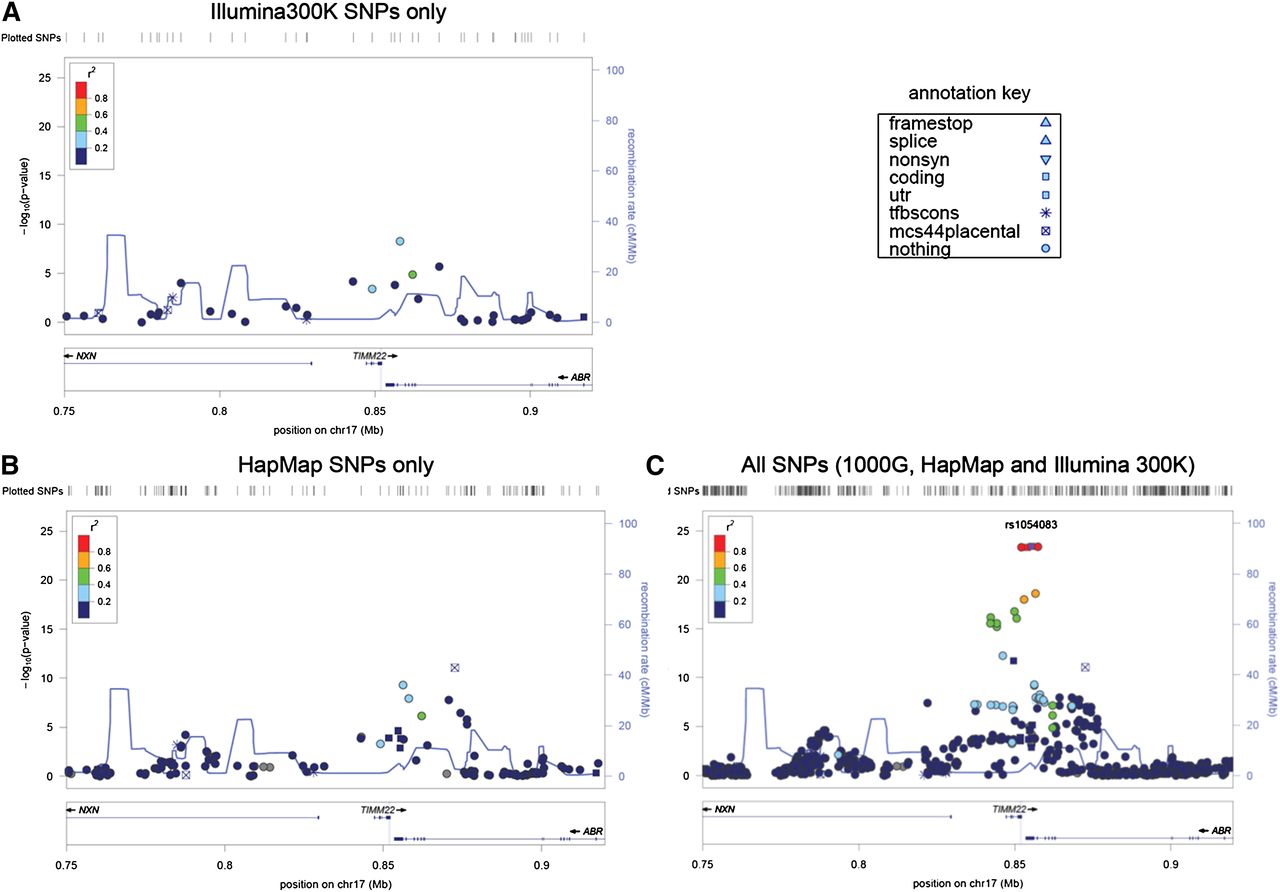
Figure 6.
cis eQTL of the gene TIMM22. A map of association of SNPs to transcript abundance of the TIMM22 gene exemplifies the progressive increase in information for the experimental genotypes (A), experimental plus HapMap imputed SNPs (B), and experimental, HapMap imputed and 1000G imputed SNPs (C). The gray vertical bar at the gene TIMM22 indicates the position of the Affymetrix probe


