
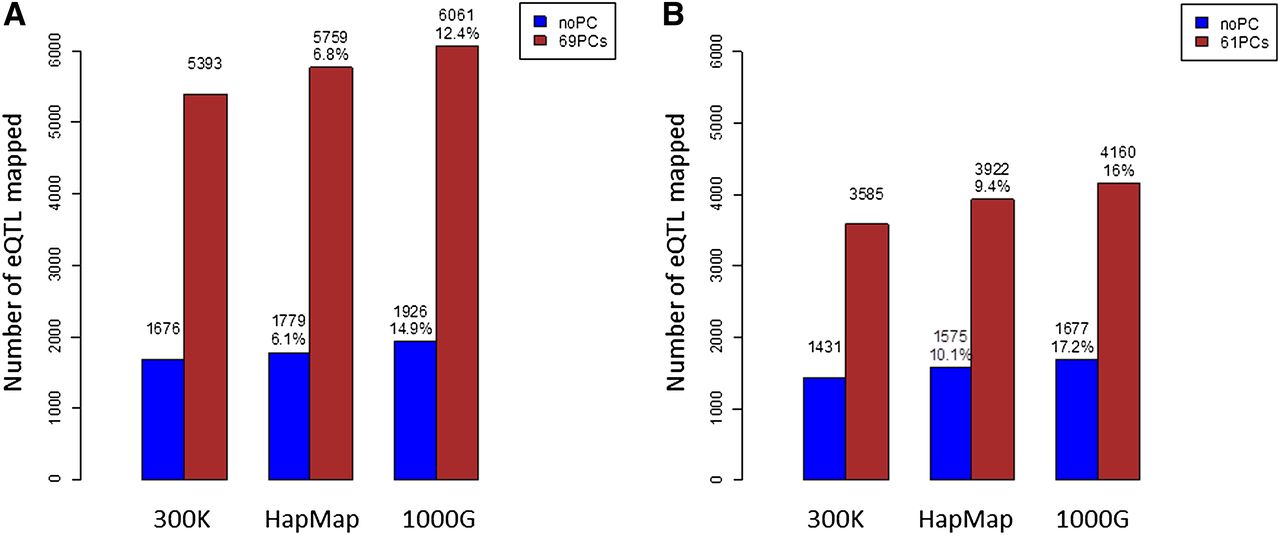
Figure 4.
Comparison of number of local eQTLs identified by directly genotyped SNPs, imputed HapMap2 SNPs, and imputed SNPs from the 1000 Genomes Project. (A) Results from Affymetrix expression data in the MRCA panel. (B) Results from Illumina expression data in the MRCE panel. (Blue bars) Original unadjusted expression; (red bars) expression values adjusted by the top principal components.


