
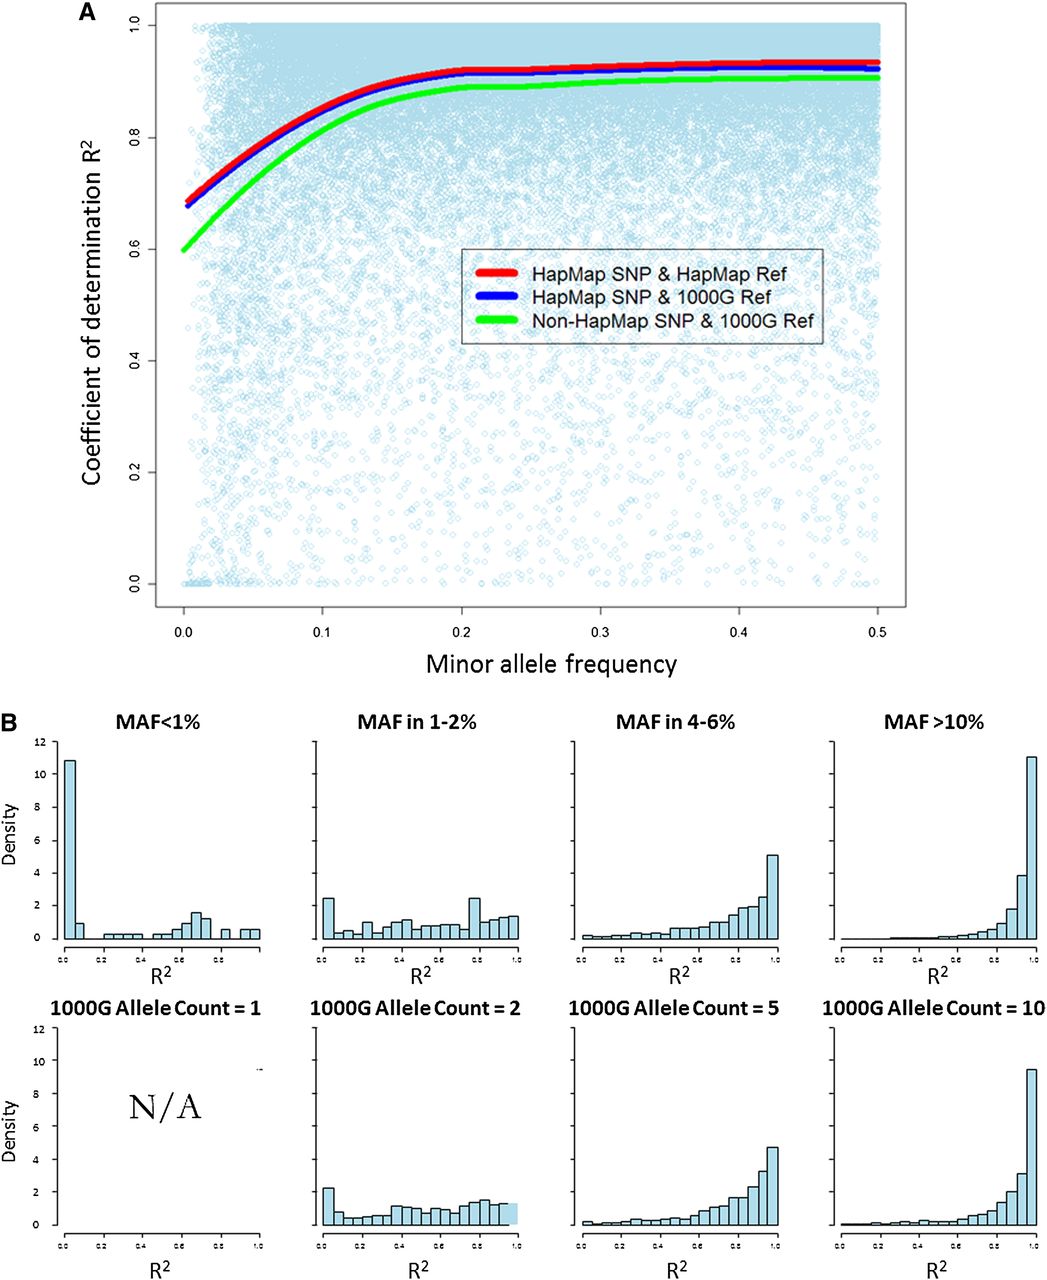
Figure 3.
Imputation accuracy by minor allele frequency (MAF; MRCA panel). (A) Correlation (R2) between 1000G imputed allele dosage derived from Illumina 300K arrays and true allele counts measured by Illumina 100K arrays, plotted by MAF. (B) Histogram of correlation with true allele counts by MAF in sample (upper panels) and minor allele counts in the 1000G reference haplotype. Note that there are no data in the bottom left panel following removal of singletons from the reference haplotype.


