
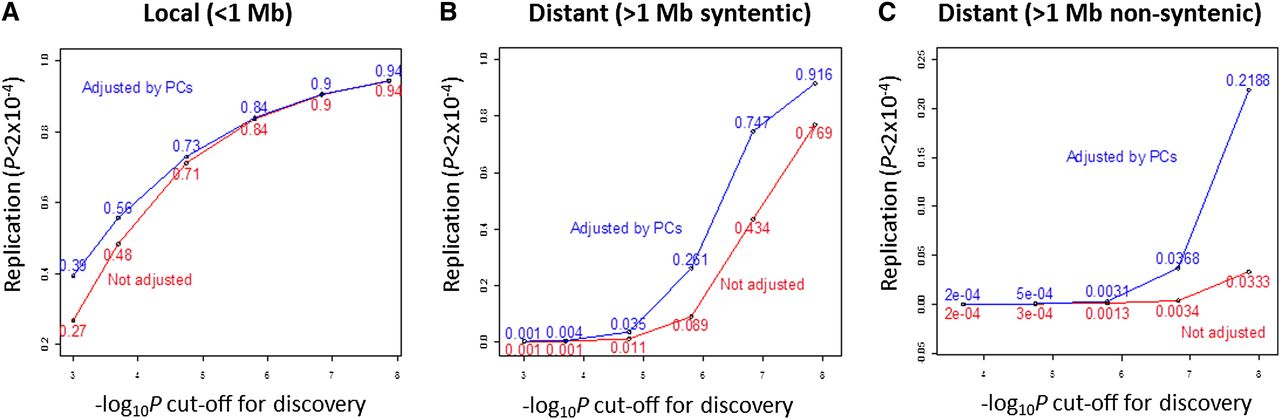
Figure 2.
Replication rate by distance from the eQTL to the transcript. (Red lines) Replication of eQTL. (A) Local effect; (B) distant syntenic effect (>1 Mb but gene and SNP on the same chromosome); and (C) distant effect (on a different chromosome). The analysis is based on autosomal SNPs from the Illumina 300K panel.


