
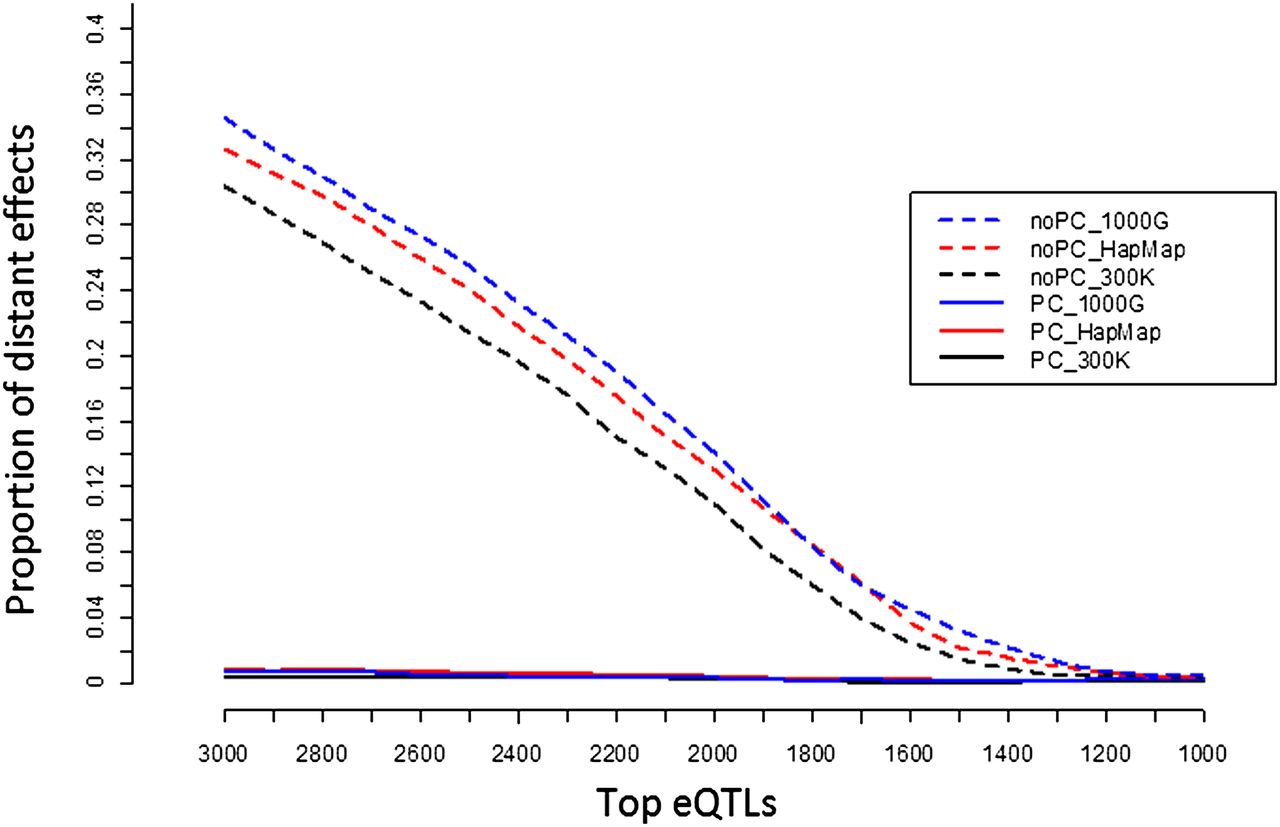
Figure 1.
Empirical estimate of false discovery rate. (noPC) Using original expression value; (PC) adjusting nongenetic effect using the top 69 principal components; (1000G) imputation using SNPs from the 1000 Genomes project; (HapMap) imputation using HapMap2 SNPs; (300K) using autosomal SNPs from the Illumina 300K panel.


