
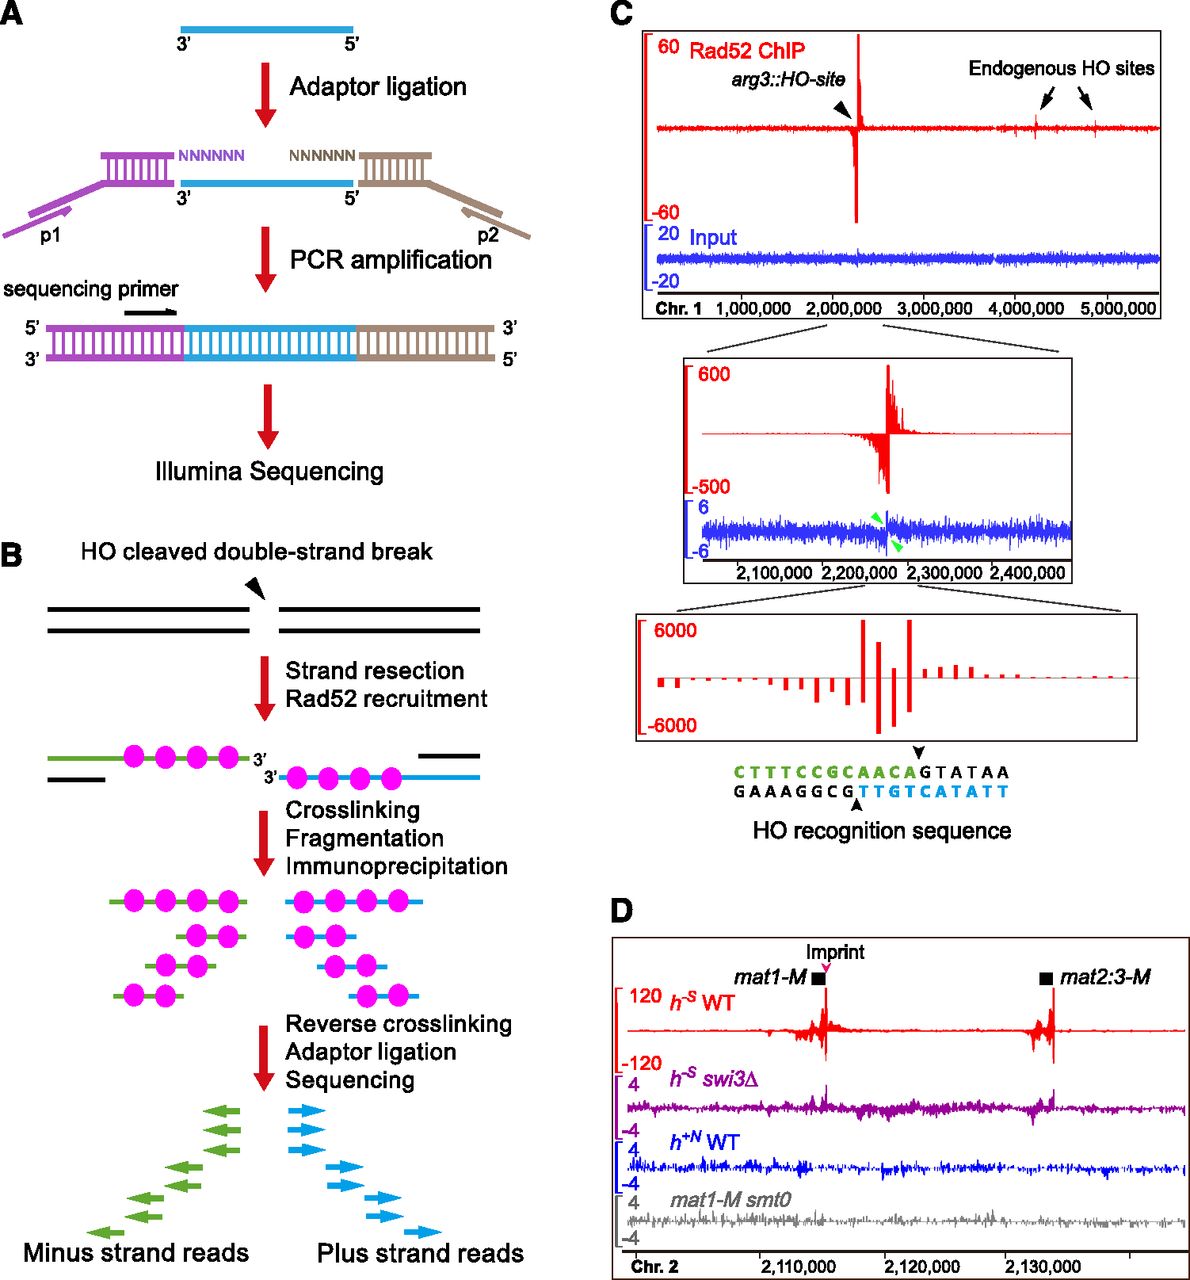
SPI-seq assay detected Rad52 bound at artificially induced and naturally occurring double-strand breaks (DSBs). (A) An adaptor-ligation scheme specially designed for single-strand DNA (ssDNA). (B) The expected outcome of SPI-seq when applied to an HO-induced DSB. Because of our adaptor-ligation design, the chromatin immunoprecipitation (ChIP)–enriched sequencing reads should map to the strands opposite to the ones bound by Rad52. (C) SPI-seq analysis of HO-induced DSBs. The upper and middle panels show the same read density profiles generated by kernel density estimation. (Upper panel) The whole chromosome 1. The y-axis scale of the ChIP signal track is limited to 60 to allow the visualization of the weak signals at the endogenous HO sites. (Middle panel) Close-up view of arg3∷HO-site and its surrounding region. The ChIP signal track shows the full height of the ChIP signal at arg3∷HO-site. Green arrowheads point to the HO-site-flanking regions where strand-specific signal loss occurred in the input, presumably due to resection. (Lower panel) ChIP-enriched reads mapped to individual nucleotide positions at the HO cleavage site, without kernel smoothing. (D) SPI-seq signals at mating-type loci. To visualize reads mapped to the duplicated mating-type cassette, nonuniquely aligned reads were randomly assigned. The units on the y-axes in C and D are reads per 10 million.


