
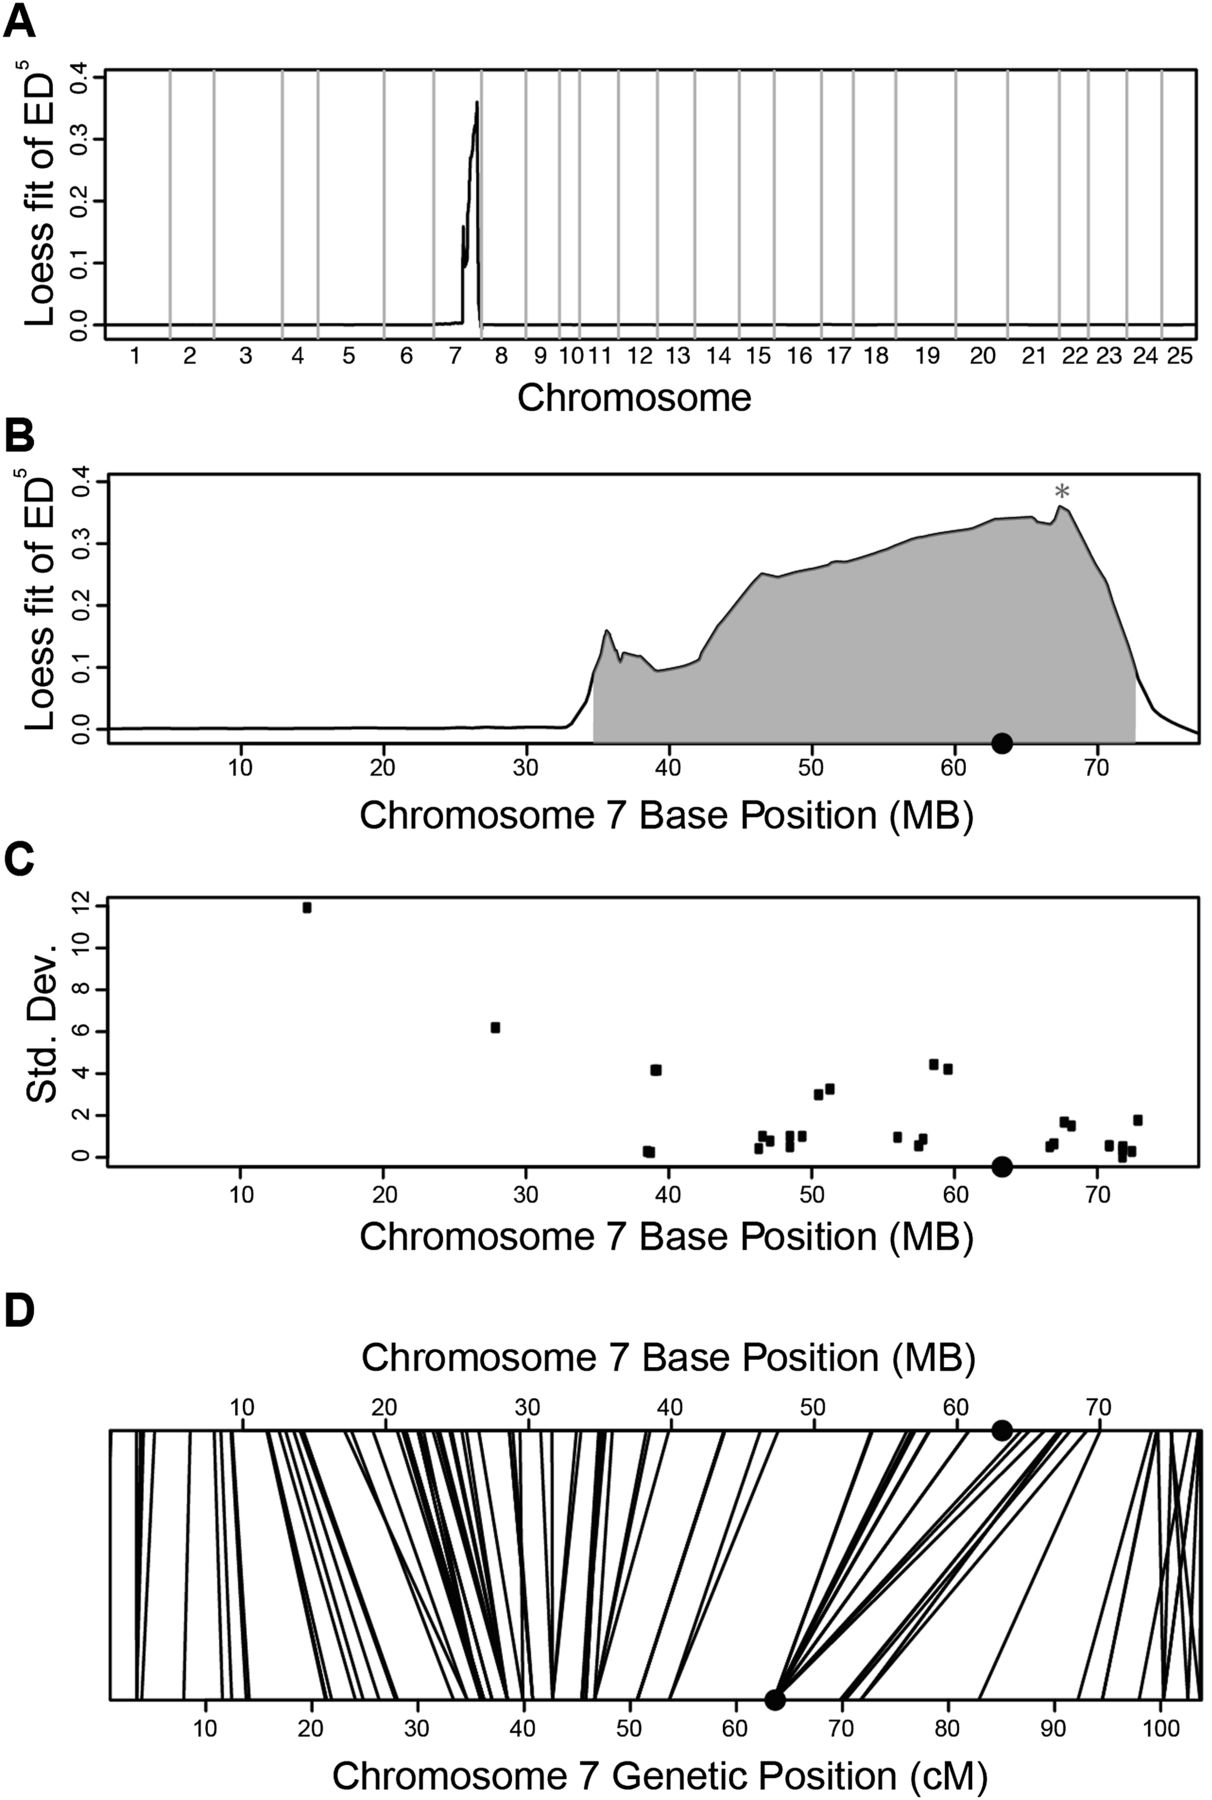
Figure 5.
Results for MMAPPR mapping of the zy13 line. (A,B) Genome-wide (A) and chromosome 7 (B) Loess fit results. (*) Location of the mutation. (C) RADseq mapping results for chromosome 7. (D) Location of SNP and microsatellite genetic map markers on the zv9 genome-build. Lines connect the genetic map position (bottom axis) to the physical map position (top axis) of each marker. (●) Centromere location on the x-axis.


