
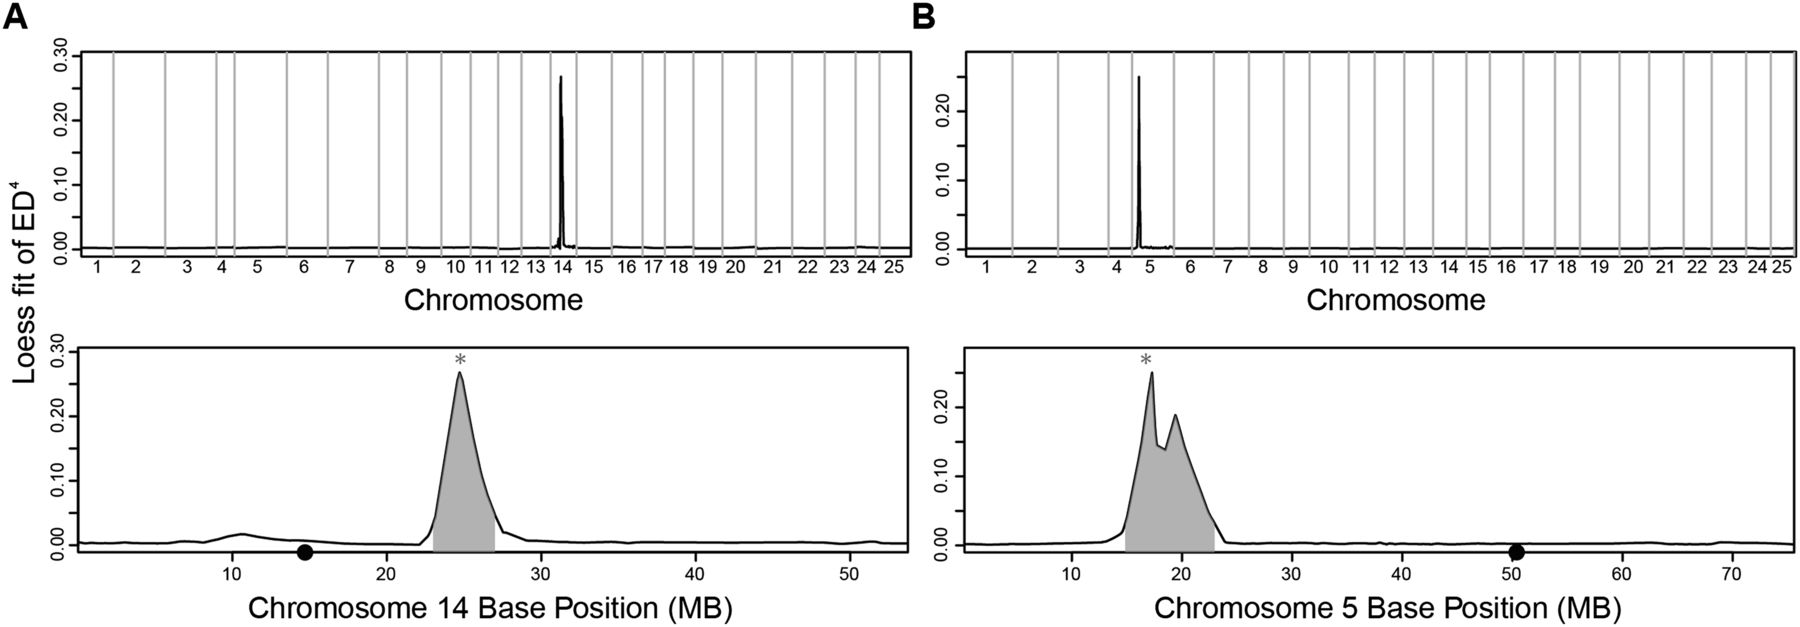
Figure 4.
Linked region peaks identified by MMAPPR for the nkx2.5 and tbx1tm208 lines. (A) Genome-wide (top panel) and chromosome 14 (bottom panel) Loess fit curves for SNP allele frequency Euclidean distance raised to the fourth power for the nkx2.5 line. (B) Genome-wide (top panel) and chromosome 5 (bottom panel) Loess fit curves for SNP allele frequency Euclidean distance raised to the fourth power for the tbx1 line. (*) The mutation location. (●) Centromeres on the x-axis.


