
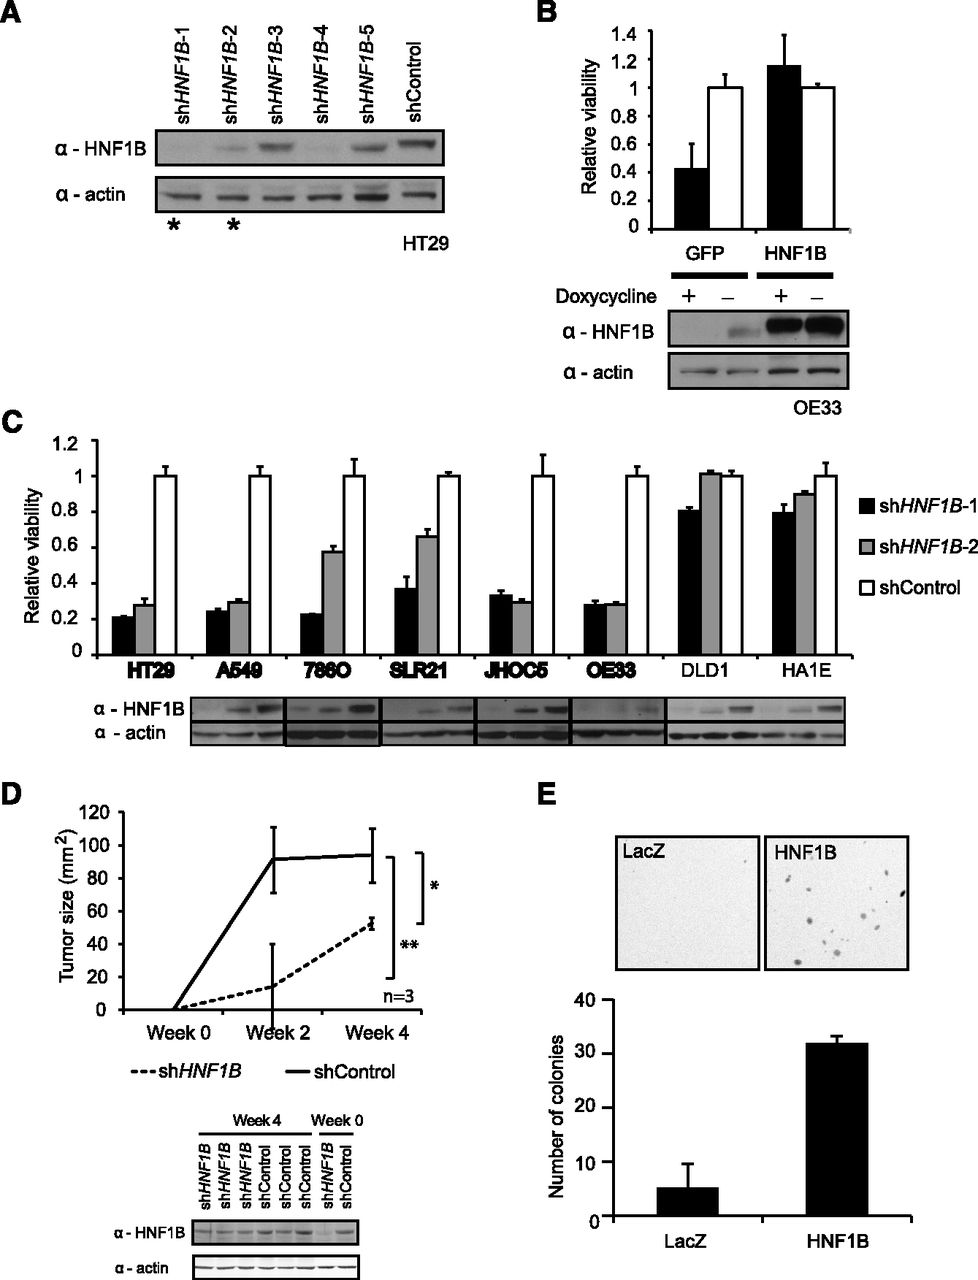
Characterizing the role of HNF1B in cancer. (A) Immunoblot of HNF1B after expression of five independent shRNAs designed to target HNF1B. (*) The two shRNAs incorporated into the ATARiS solution, which also have the highest consistency scores. (B) Cell viability upon exogenous expression of HNF1B or GFP in an HNF1B-sensitive cell line OE33 with stable integration of doxycycline-inducible expression of shHNF1B-1. Each bar in the graph corresponds to the immunoblot lane directly below. (C) Relative viability of a panel of cell lines upon suppression of control or two HNF1B-specific shRNAs. Cell lines with high levels of HNF1B are shown in bold text. Each bar in the graph corresponds to the immunoblot lane directly below. Each boxed image derives from a separately exposed gel, as the HNF1B-amplified samples express much higher endogenous levels of HNF1B (Supplemental Fig. 10). Data for HT29 are shown in panel A. (D) HNF1B-sensitive cell line HT29 expressing shHNF1B-1 or shControl was implanted subcutaneously into immunocompromised mice. ShHNF1B-1 was used for all experiments since it has potent effects and is specific for HNF1B, as shown in panels A and B. Tumor volume was monitored biweekly, and lysates were collected pre-implantation and from tumors at 4 wk. (*) P-value <0.05; (**) P-value <0.01 (one-tailed Student's t-test). (E) HNF1B or LacZ was expressed in HA1EM cells and anchorage-independent growth was determined. Representative photos shown after 6 wk. (Error bars) ±1 SD (n = 3).


