
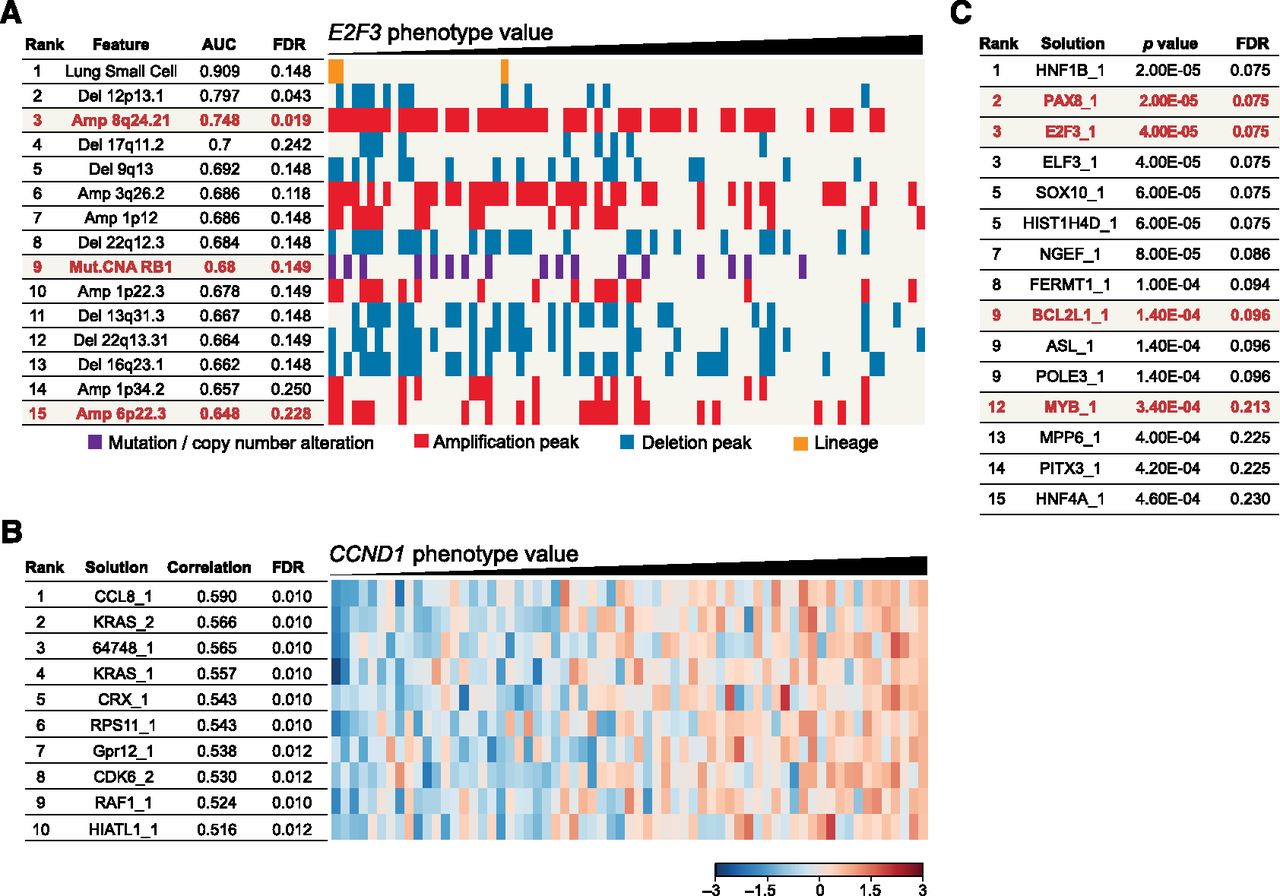
ATARiS phenotype values enable phenotype-based analyses for biological discovery. (A) Identifying genomic predictors of dependency on E2F3. Genomic features are shown ranked by their correspondence to E2F3 phenotype values as measured by the area under receiver operating characteristic curve (AUC). (Amp) Amplification and (Del) deletion peaks, as determined by GISTIC. Columns correspond to individual cell lines. (Red) Genomic alterations pertinent to E2F3. (B) Correlations between gene phenotype value profiles to CCND1 gene solution. Gene solutions are ranked by their similarity to the CCND1 gene solution using the Pearson correlation coefficient. P-values were generated by permutation of sample labels. (C) Identifying significant cancer genes by integrating expression data and phenotype values. Gene solutions are ranked by increasing the Pearson correlation coefficient between the solution and expression data for the corresponding gene. Thus, genes that are essential in samples with high expression and less essential in samples with low expression are more negatively correlated, and receive higher ranks. P-values were calculated from a null distribution derived by permutation of sample labels. (Red) Previously reported gene dependencies in cancer. Numbers following gene names in B and C indicate gene solution number (see the Supplemental Data). (FDR) False discovery rate.


