
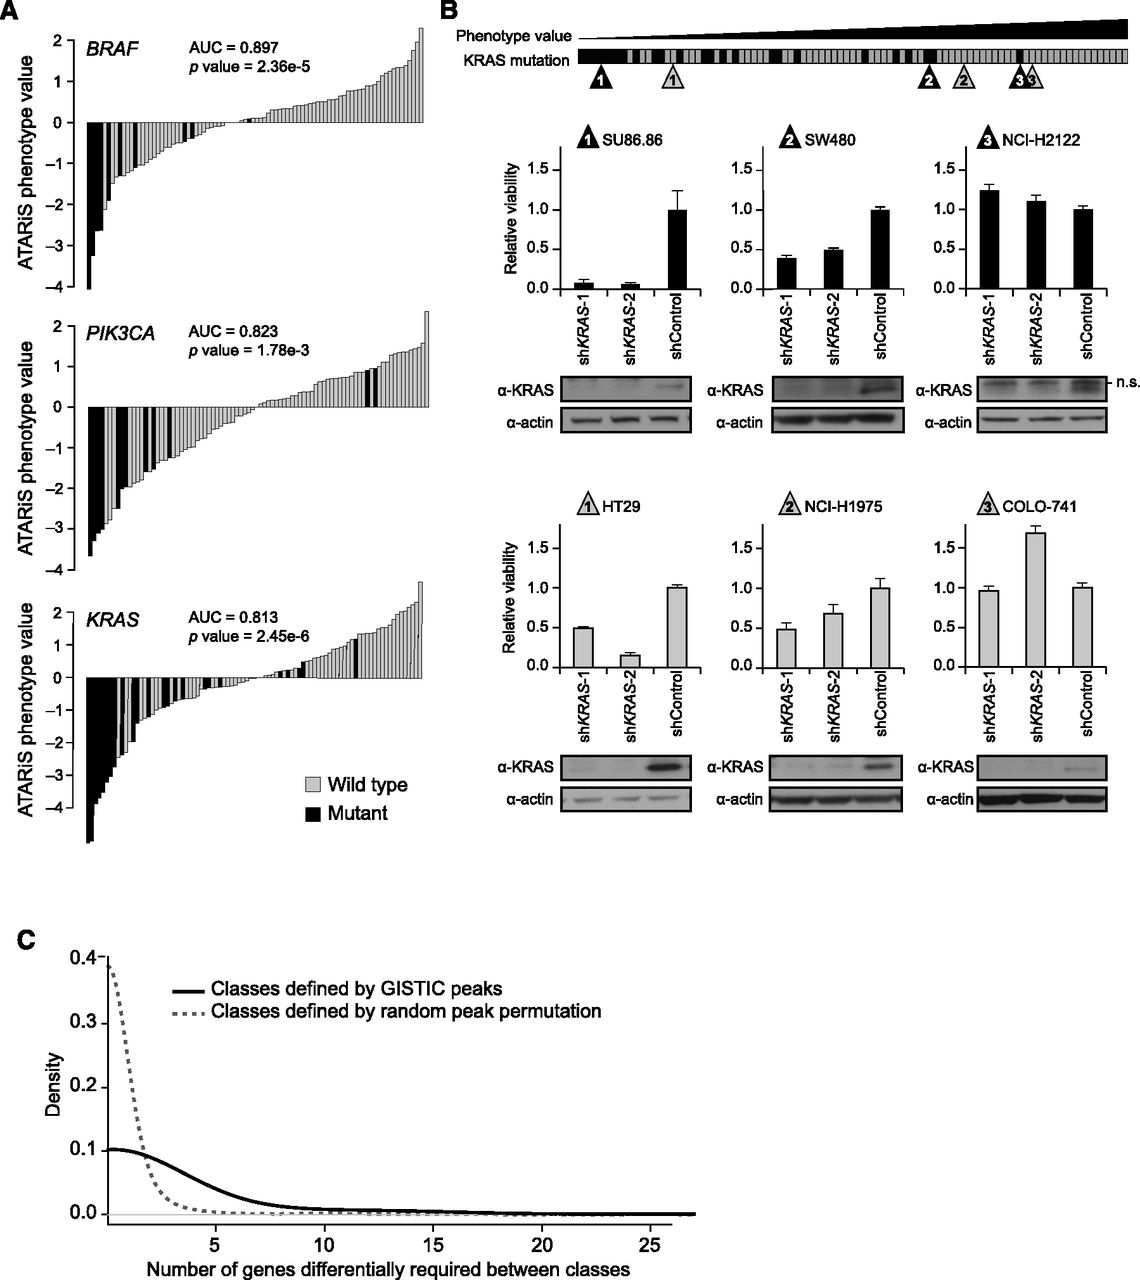
ATARiS gene phenotype values reflect biological dependencies. (A) Correspondence between gene mutation status and ATARiS phenotype values for BRAF, PIK3CA, and KRAS. Each vertical bar represents a single screened sample, colored by mutation status. In each plot, samples are ordered by increasing phenotype values. (AUC) Area under receiver operating characteristic curve. P-value, assessed by Mann-Whitney test. (B) Low-throughput validation of the relationship between gene phenotype scores and gene dependency. Six cell lines infected with shKRAS were counted 4 d post-selection to determine cell number relative to infection with control shRNA. Immunoblots were performed using lysates from each sample collected at 2 d post-selection and stained using primary antibodies from Santa Cruz Biotechnology KRAS (sc-30) or actin (sc-1615). Immunoblot lanes correspond to bars in the graph directly above. Horizontal bar orders all cell lines with known KRAS mutation status in increasing order by ATARiS phenotype value, with validated samples marked by corresponding triangles. (Gray) KRAS wild-type; (black) KRAS mutant; (error bars) ±1 SD (n = 3); (n.s.) non-specific band. (C) Genes differentially required in sample classes defined by recurrent amplification or deletion peaks. Recurrent genomic peaks were identified by GISTIC analysis across genomic data for samples from the Cancer Cell Line Encyclopedia. For each peak existing in at least six samples screened in Project Achilles (n = 101), two classes of samples were defined based on presence or absence of the peak. Genes that are differentially required in samples harboring the peak as compared with samples that do not (FDR <0.25) were determined. The distribution of the number of significantly differential genes is shown. For comparison, the same analysis was performed using classes defined by random permutation of peak assignments.


