
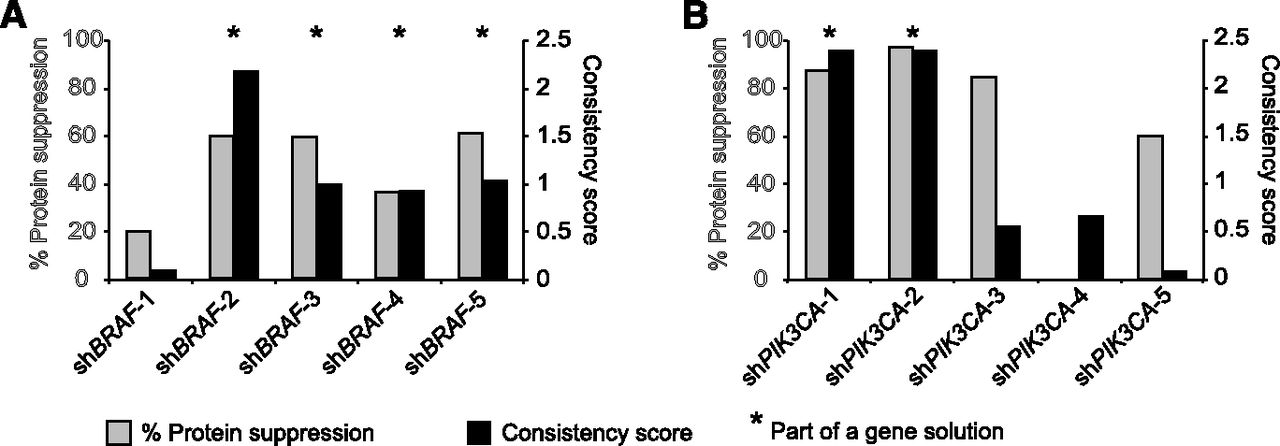
ATARiS consistency scores are associated with on-target gene suppression. Consistency scores computed by ATARiS and corresponding protein suppression levels by immunoblotting are shown for shRNAs targeting (A) BRAF and (B) PIK3CA. A higher consistency score represents greater confidence that the effects produced by the shRNA are due to suppression of the target gene. Immunoblotting for the effect of each shRNA compared with control shRNA was performed in cell line A549 and percent suppression compared with control shRNA was calculated based on quantification by ImageJ software. Shading of the axis labels corresponds to data bars of the same type. (*) Reagents used in the gene's ATARiS gene solution.


