
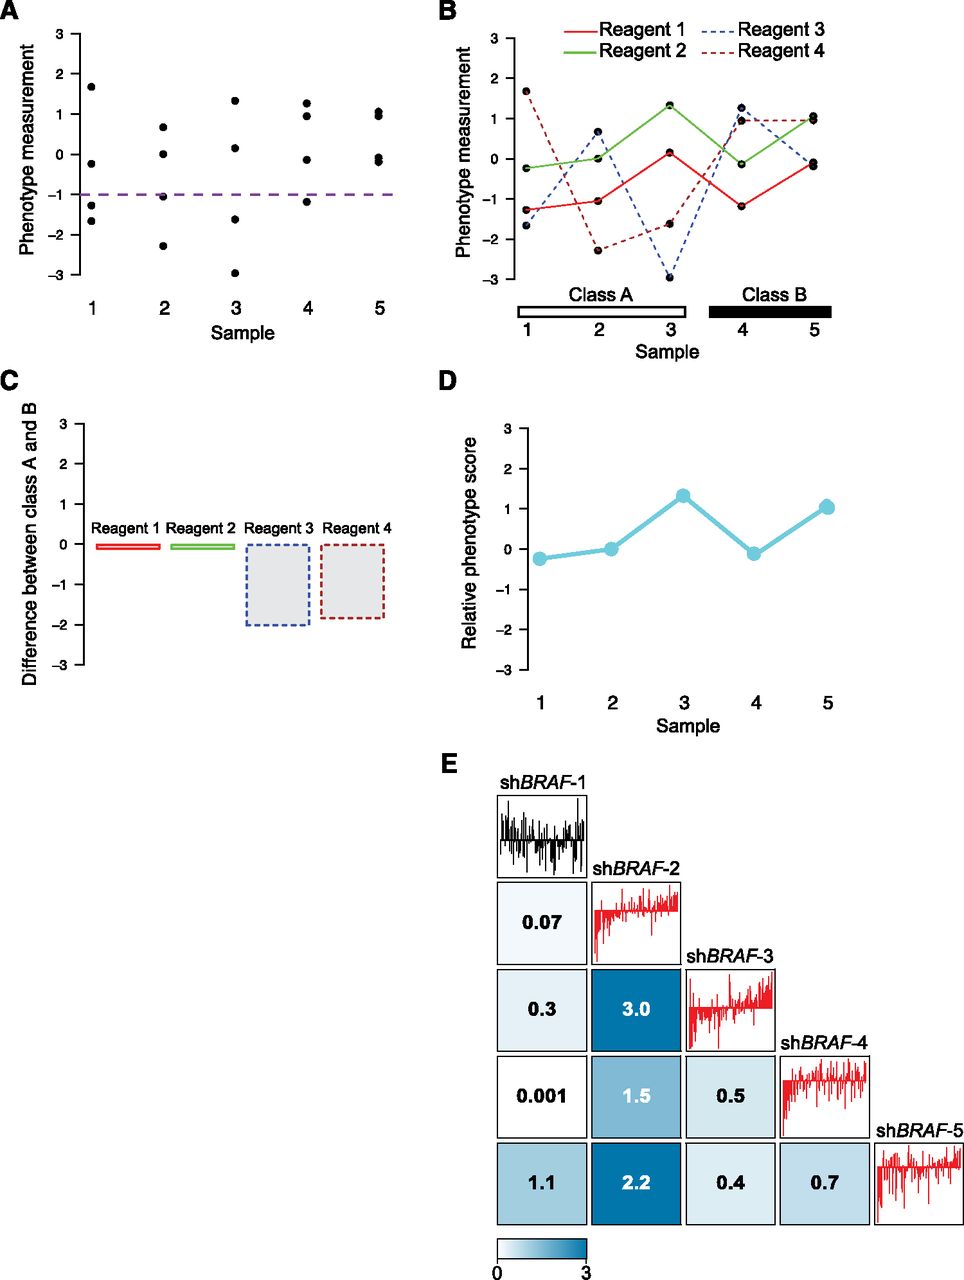
ATARiS accounts for patterns in RNAi reagent data in order to quantify the phenotypic effect of gene suppression in each sample. (A–D) Hypothetical phenotypic data from four RNAi reagents, all designed to target the same gene, in five independent samples from two classes, A and B. (A) Samples 1, 2, and 3 each have at least two reagents that score below a desired threshold (purple dotted line); thus, according to “frequency approach” methods, this gene may be a “hit” in those samples. (B) A line connecting each reagent's effects across the samples reveals additional information. Specifically, we note that it is possible (as in this scenario) that different shRNAs drive the determination of hits in each sample when samples are each analyzed separately as in A. (C) For each reagent, the difference between its mean values in class A and class B is shown, reducing much of the noise from individual samples. Reagents 3 and 4 both show differential effects between the classes and would suggest that two-class-based analytic methods select this gene as a hit. (D) ATARiS phenotype values for each of the screened samples. Phenotype values represent relative gene-level effects in each individual sample by incorporating information from trends across all samples, favoring reagents that produce correlated effects (i.e., reagents 1 and 2 from B). If the user chooses to assess whether differential effects exist between classes A and B, this example would show no significant difference by avoiding uncorrelated reagents 3 and 4. (E) Real data from the Project Achilles data set for shRNAs targeting BRAF. Median-normalized screening data across 102 samples are displayed as barplots in sample order of ascending BRAF phenotype value. Boxed numbers display −log10 P-values of the Spearman correlation coefficient for the two shRNAs labeled in the corresponding row and column. (Red) shRNAs with correlated effects that are incorporated into the BRAF gene solution.


