
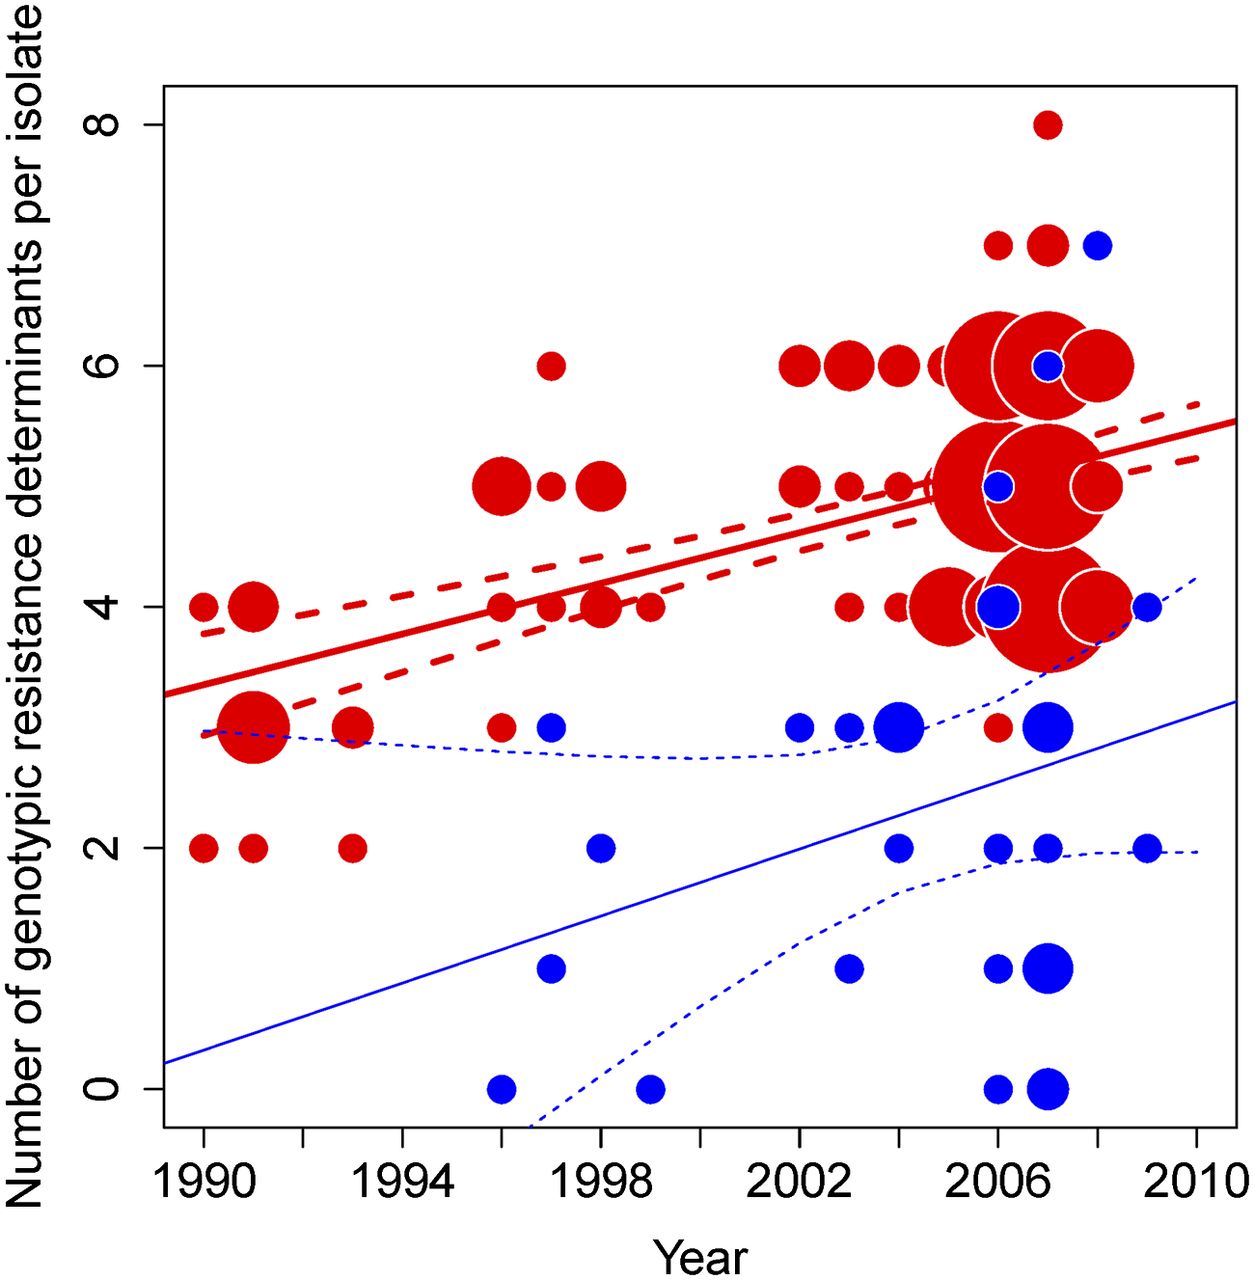
Figure 5.
Increase in antibiotic resistance traits within ST22-A population over time. Number of genotypic resistance determinants per ST22-A isolate (red, no. 162) and non-ST22-A isolates (blue, no. 31) from all countries, 1990–2008, including regression lines with 95% confidence interval for each group. Size of circle corresponds to number of isolates.


