
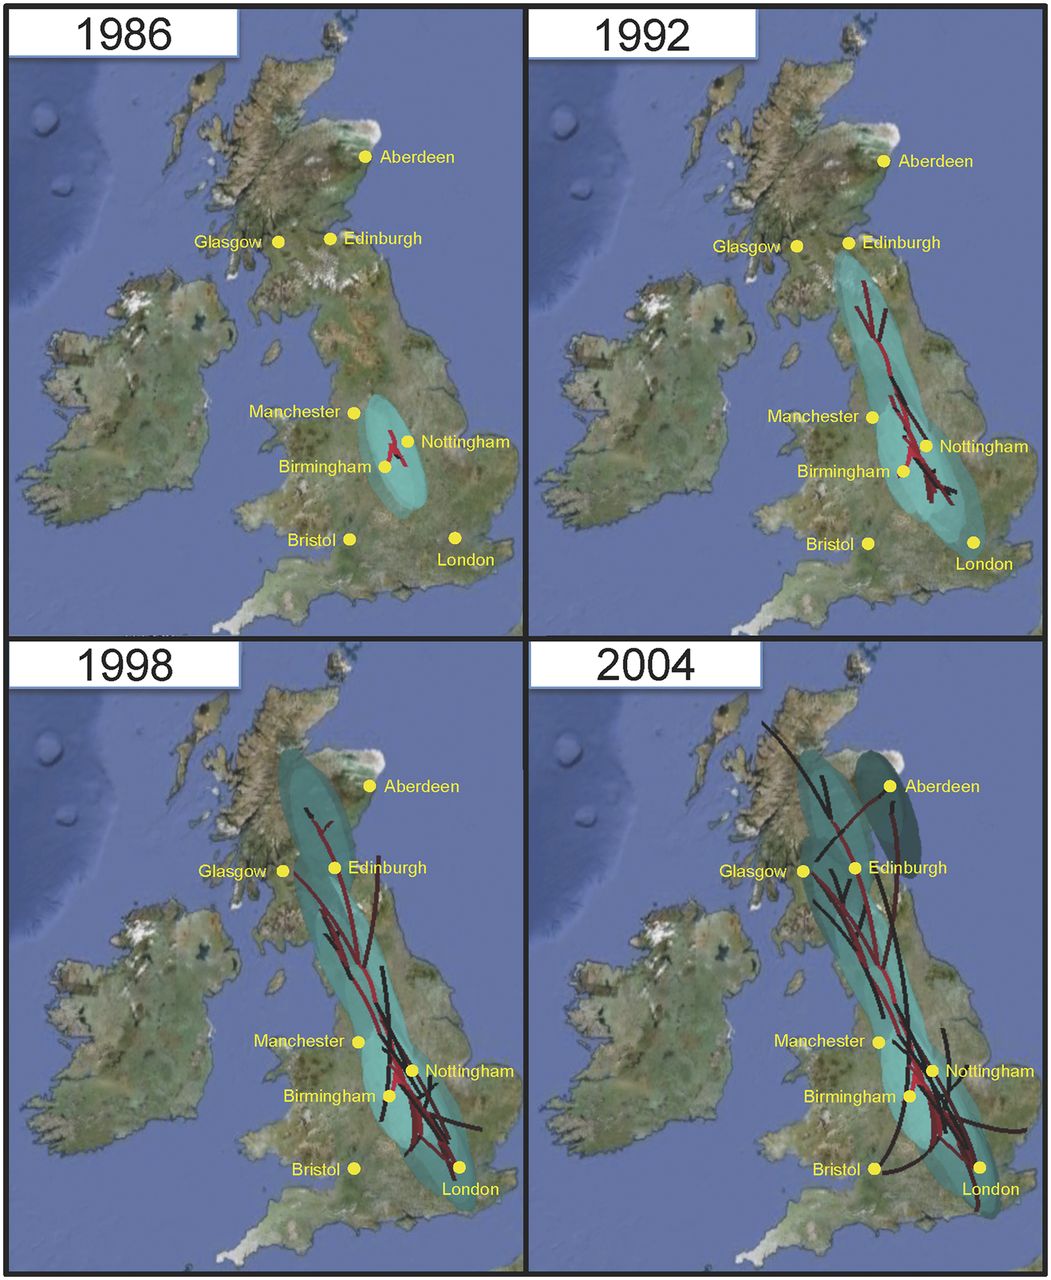
Bayesian reconstruction of the spread of ST22-A2 in the UK. A continuous spatial diffusion model was used to reconstruct the finer-scale geographical dispersal of ST22-A2 within the UK and to predict the origin of fluoroquinolone resistance. Lines indicate the inferred routes of spread with confidence displayed as green ovals representing 80% of the highest posterior density (HPD) for latitude and longitude. The timing of transmission events are represented by red (old) to black (recent) lines and light- to dark-green oval shading (for the animation of the reconstruction of the spread, see Supplemental File S2). The maps are based on satellite pictures made available at Google Earth (http://earth.google.com).


