
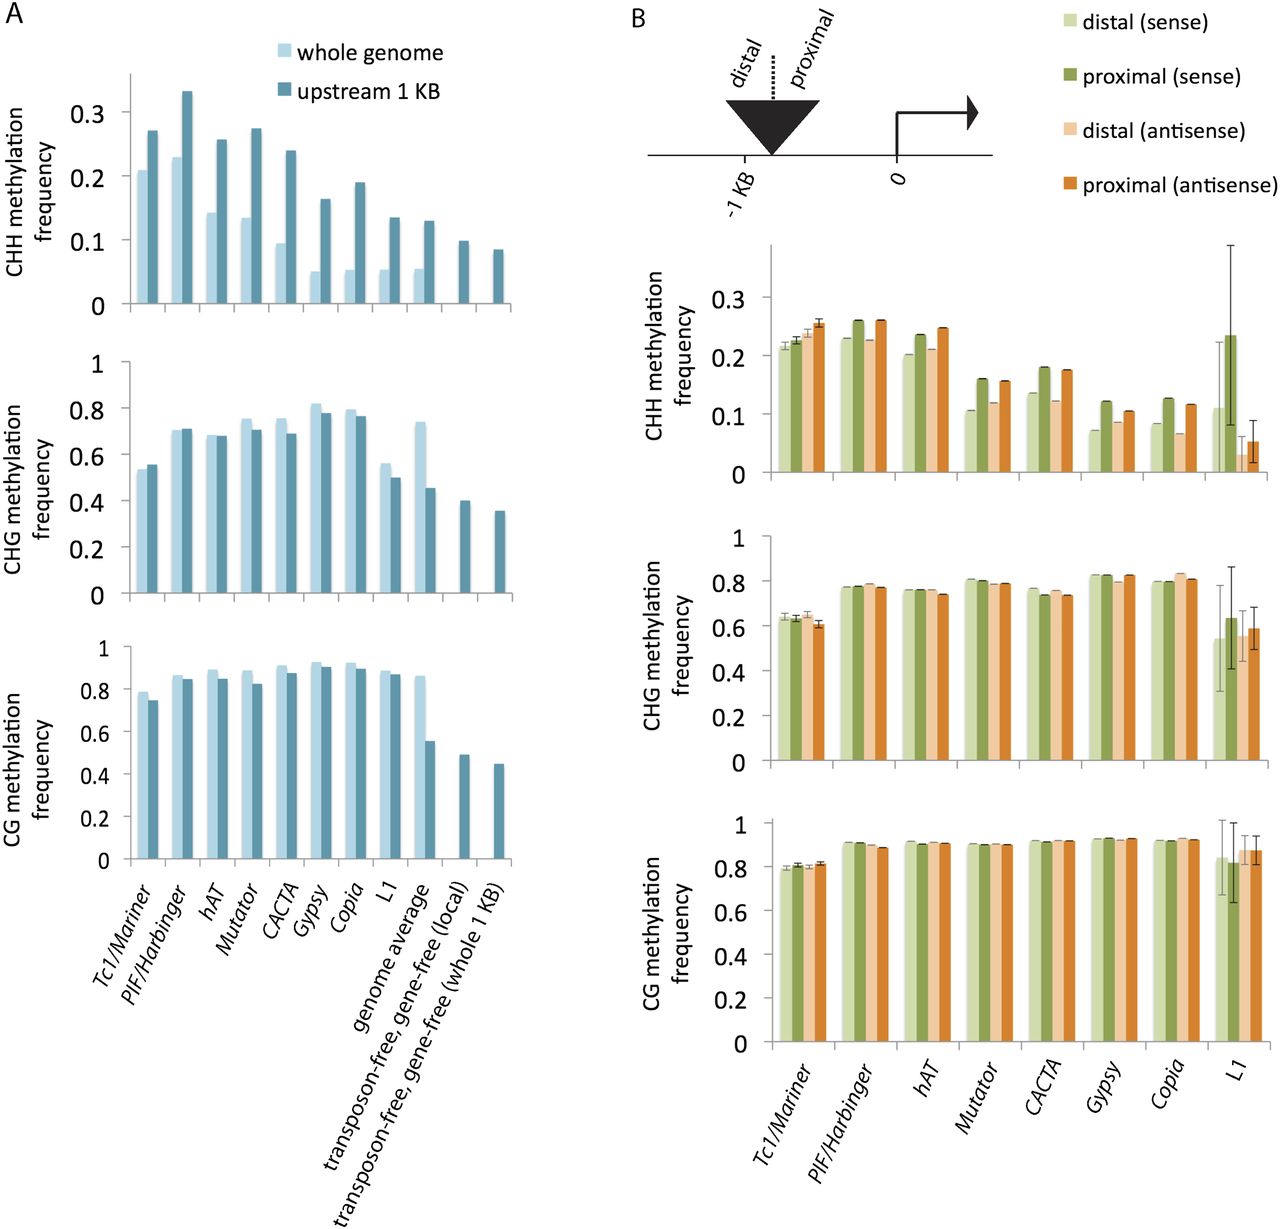
Methylation of transposons. (A) Comparison of transposon methylation in 1-kb regions upstream of genes with transposon methylation in the whole genome. In cases where a transposon copy extended beyond the 1-kb region, only the overlapping portion contributed to the analysis. For each superfamily, the difference in CHH methylation between the set of all copies (light blue, whole genome) and the subset upstream of genes (darker blue) was statistically significant (P-value < 0.005). Also shown are genome averages (both for the whole genome and for the regions within 1-kb upstream of genes) and transposon-free comparisons. Since excluding transposons enriched for genes, genes were also excluded. “Local” consists of portions of 1-kb regions that do not correspond to transposons or genes; “whole 1 KB” excludes entire 1-kb regions if they overlap at all with transposons or genes. (B) Comparison of methylation within single transposon copies relative to proximity of nearby genes. Copies that were contained in or overlapped with the region 1-kb upstream of genes were split into two halves, and the levels of methylation for the proximal and distal halves were measured separately. The transposons were also categorized by orientation relative to the genes, and the methylation averages for each orientation are shown separately. (Error bars) Standard errors of the means. For each of the superfamilies except for Tc1/Mariner and L1, the differences in CHH methylation between each half were statistically significant for both orientations (P-value < 0.005).


