
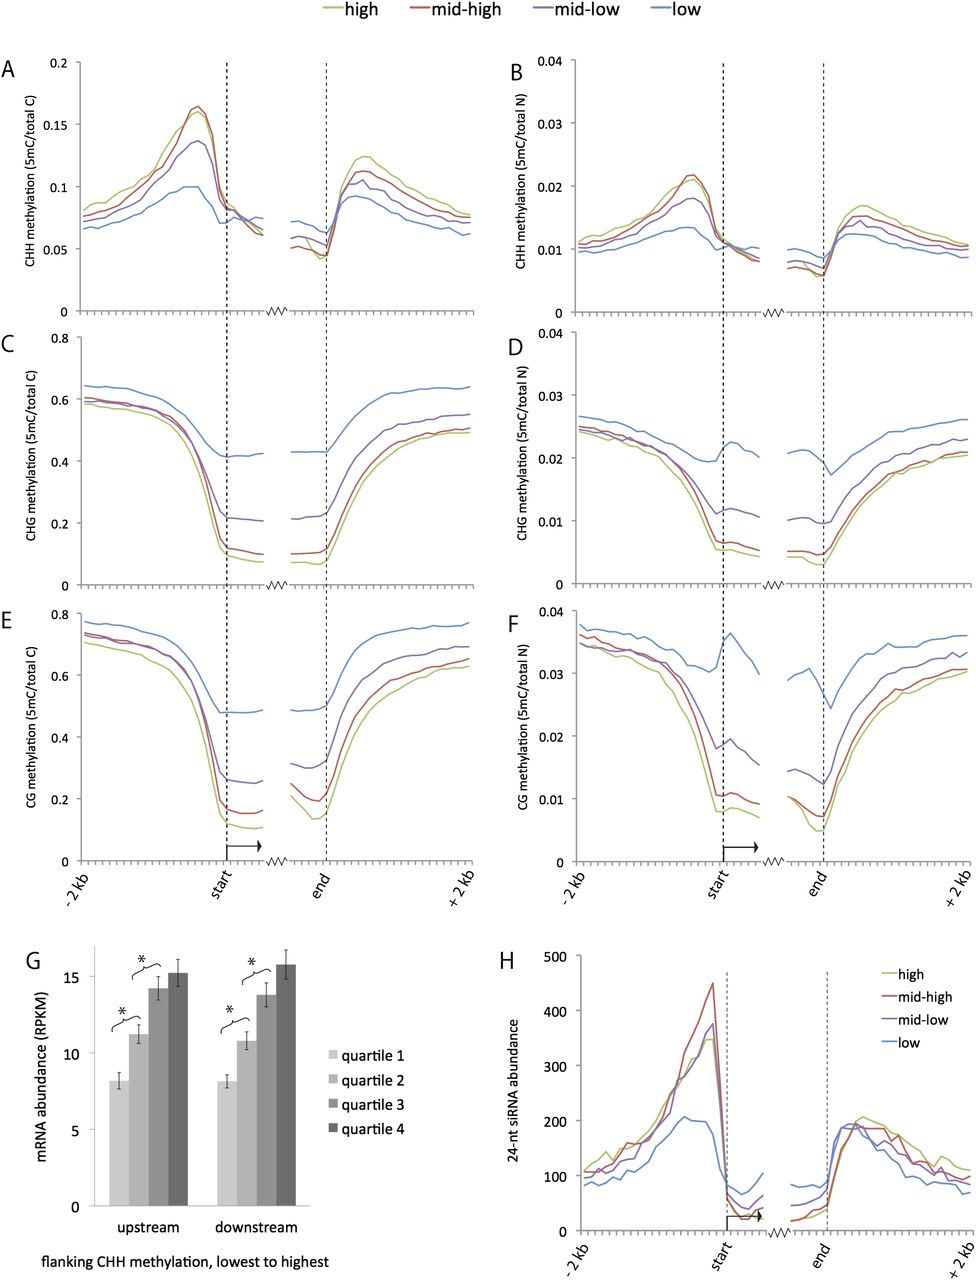
Genome-wide summary of 24-nt siRNA and methylation distributions near genes. (A–F) Distributions of methylation in each sequence context near genes. Both relative frequency (5-methylcytosine over total cytosine in the specific sequence context) and absolute frequency (5-methylcytosine over total nucleotides) are shown. The genes were divided into four sets based on expression level. Methylation values were measured for each 100-bp interval in a 2-kb region upstream of and downstream from gene ends for all annotated genes in the filtered gene set (version 5b). Values were also measured for the first 600 bp inside genes on each end. (G) Comparison of gene expression vs. flanking CHH methylation. Genes were split into four quartiles based on the level of CHH methylation in either the upstream or downstream 1 kb. The average expression level for each quartile is shown in RPKM (reads per kilobase per million mapped reads). (Error bars) Standard errors of the means; (*) statistically significant difference between means (P-value < .005). (H) Distributions of 24-nt siRNAs near genes. The average number of 24-nt siRNAs that aligned within each 100-bp interval is displayed for each set of genes. Both uniquely aligning and repetitive siRNAs are included in this plot. For an analysis of just unique siRNAs, see Supplemental Figure S2A.


