
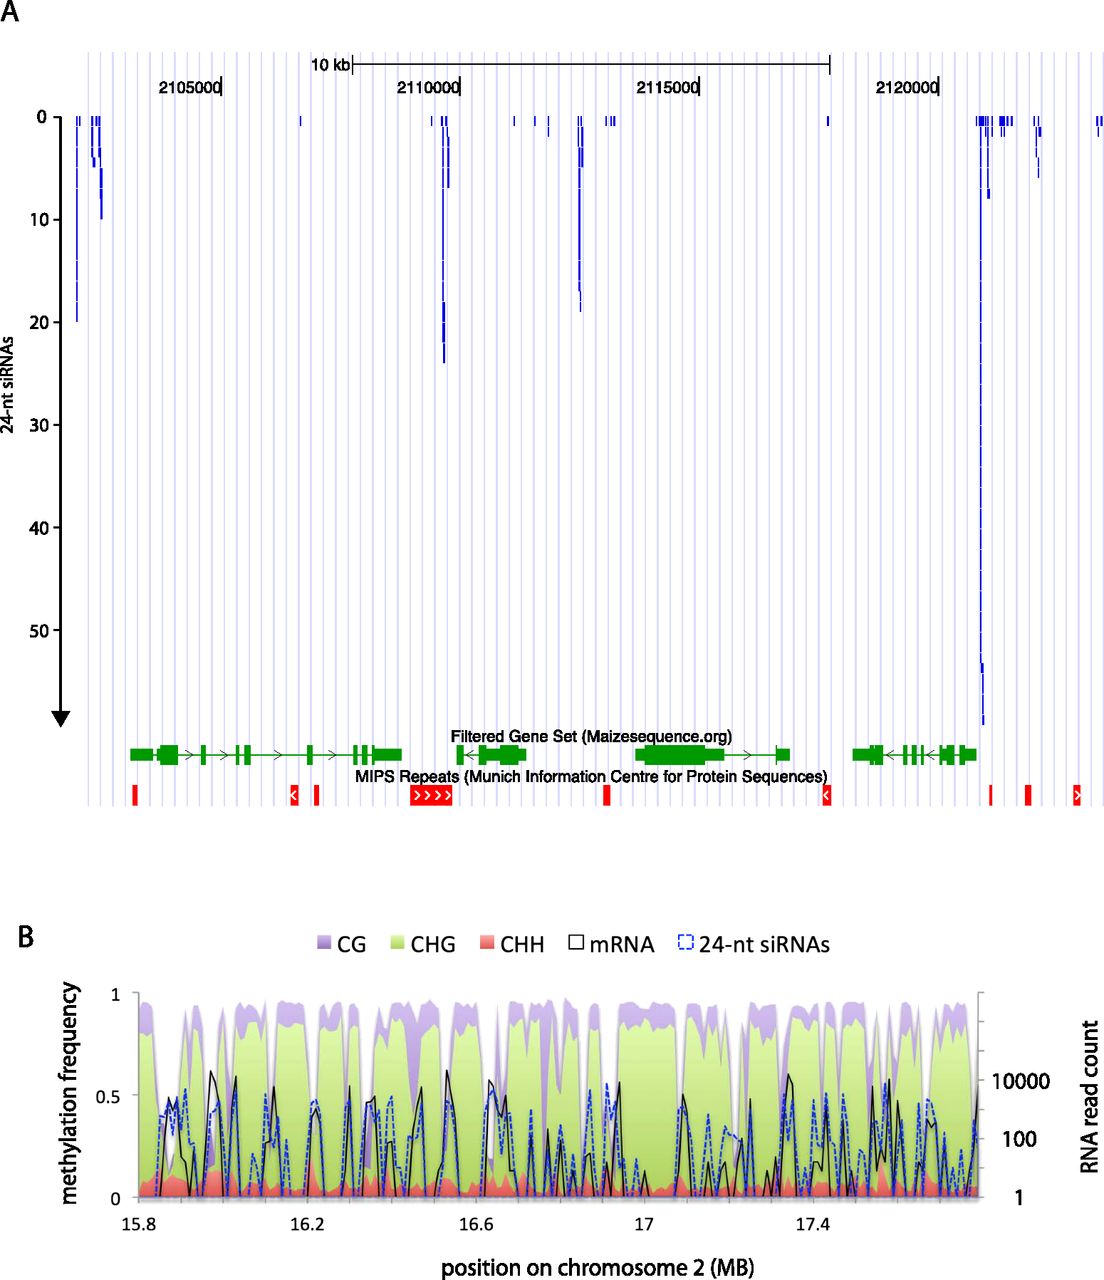
Example distributions of 24-nt siRNAs and methylation near genes. (A) An example of an ∼20-kb region of chromosome 2 showing clusters of 24-nt siRNAs near genes. Each blue segment represents a single siRNA. The figure was modified from a screenshot from the Genomaize Genome Browser (http://genomaize.org; released 15 March 2012) with the B73 reference genome, version 2. Genomaize is derived from the UCSC Genome Browser (Kent et al. 2002). (B) An example 2-mb region of the genome showing methylation frequency (methylcytosine per total cytosine in each specific sequence context, left axis) and RNA abundance (normalized read count, right axis) for each 10-kb interval. mRNA reads are from a previously published study (Wang et al. 2009). For mRNA in A and siRNA reads in B, repetitively mapping reads were excluded.


