
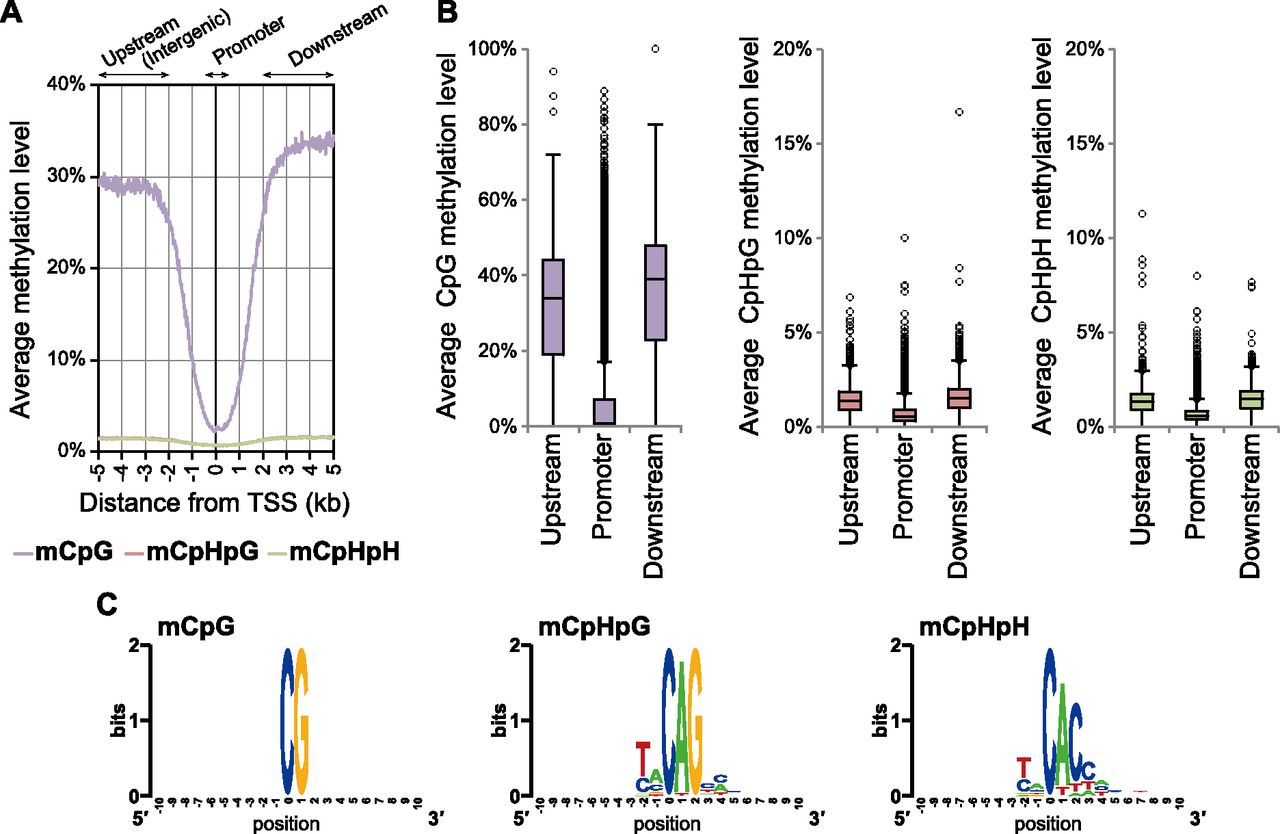
Figure 5.
(A) The distribution of cytosine methylation in male gonocytes (E16.5mPGCs) is shown ±5 kb from the transcription start site (TSS). Methylation levels of CpG (light purple), CpHpG (red), and CpHpH (green) contexts. (B) Box plots of each methylation level for 20,854 RefSeq annotated genes at areas −2 to −5 kb from the TSS (upstream/intergenic), ±500 bp from the TSS (promoter), and +2 to +5 kb from the TSS (downstream). (C) WebLogo plots for sequences proximal to highly methylated cytosines (mC/C ≥ 50%) in all three sequence contexts in E16.5mPGCs.


