
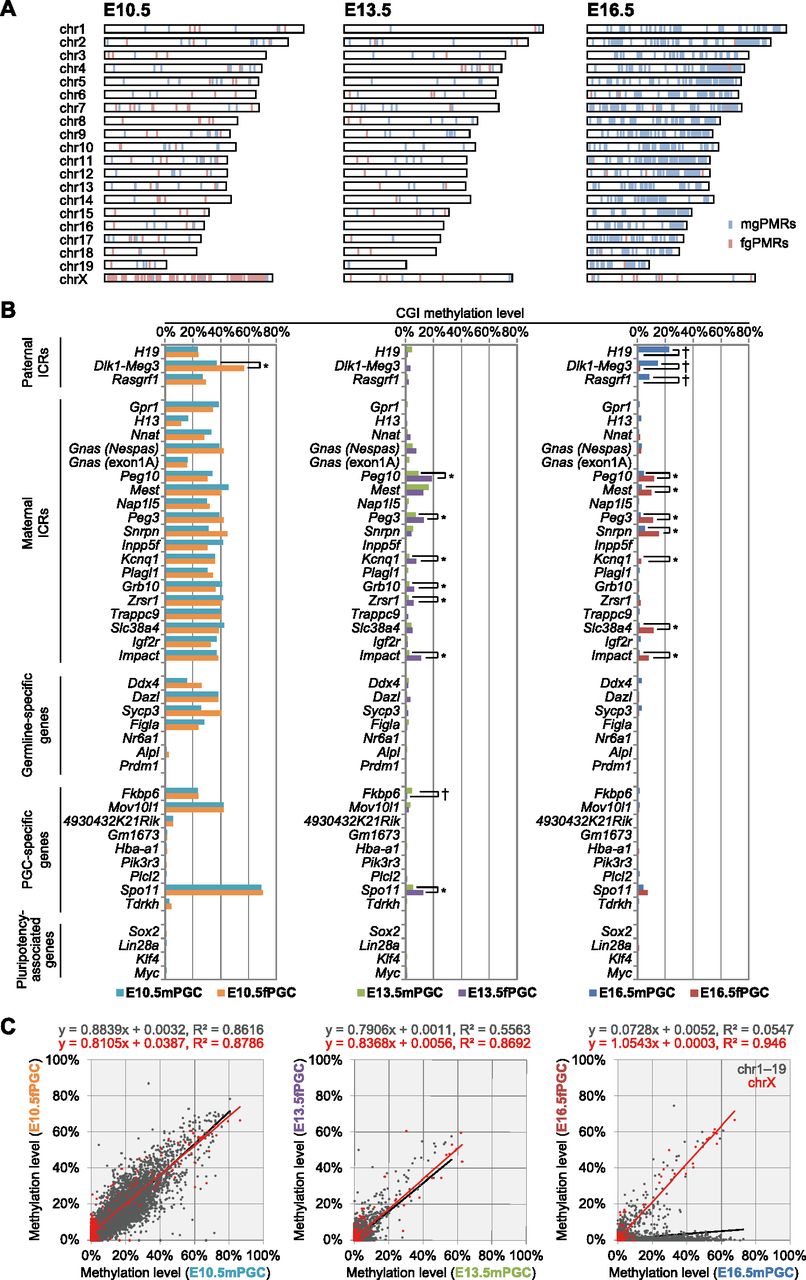
DNA methylation profiles of mouse CGIs in developing PGCs. (A) Chromosome distribution of male and female germ cell–specific preferentially methylated regions (mgPMRs and fgPMRs, respectively) in E10.5–E16.5 PGCs. Mann-Whitney's U-test was performed to determine gender-specific PMRs between male and female CpG methylation profiles of CGIs (FDR-adjusted P-values < 0.05). The locations of mgPMRs and fgPMRs are indicated as light blue and light red bars, respectively. (B) CpG methylation profiles of paternal ICRs, maternal ICRs, germline-specific genes, PGC-specific genes, and pluripotency-associated genes during PGC progression. (†) CGIs identified as mgPMRs; (*) CGIs identified as fgPMRs. (C) Scattergraphs show the relationships between the methylation levels of individual CGIs on autosomes (gray) and chromosome X (red) in male and female PGCs. Linear approximations with squared correlation coefficient (R2) values are shown at the top of each graph.


