
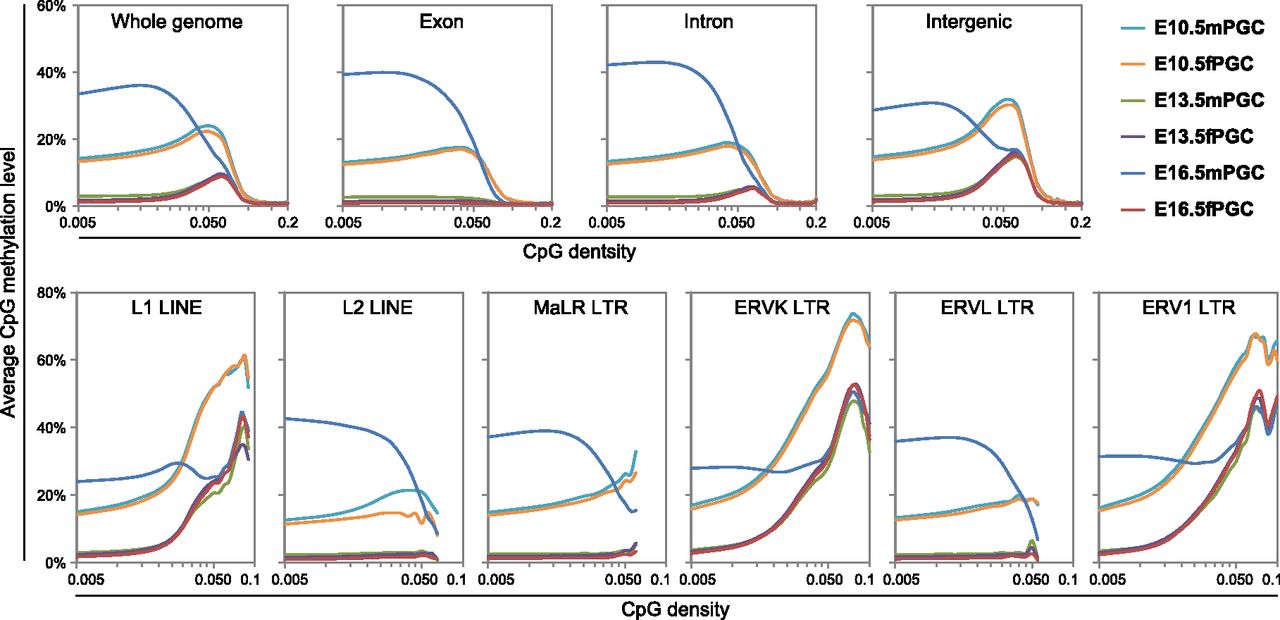
Figure 3.
DNA methylation profiling of intra- and intergenic regions in mouse PGCs. CpG methylation levels are plotted as a function of CpG densities for whole-genome, exons, introns, intergenic regions (upper panels), and six major families of LINE/LTR retrotransposons (L1 LINEs, L2 LINEs, MaLR LTRs, ERVK LTRs, ERVL LTRs, and ERV1 LTRs [lower panels]).


