
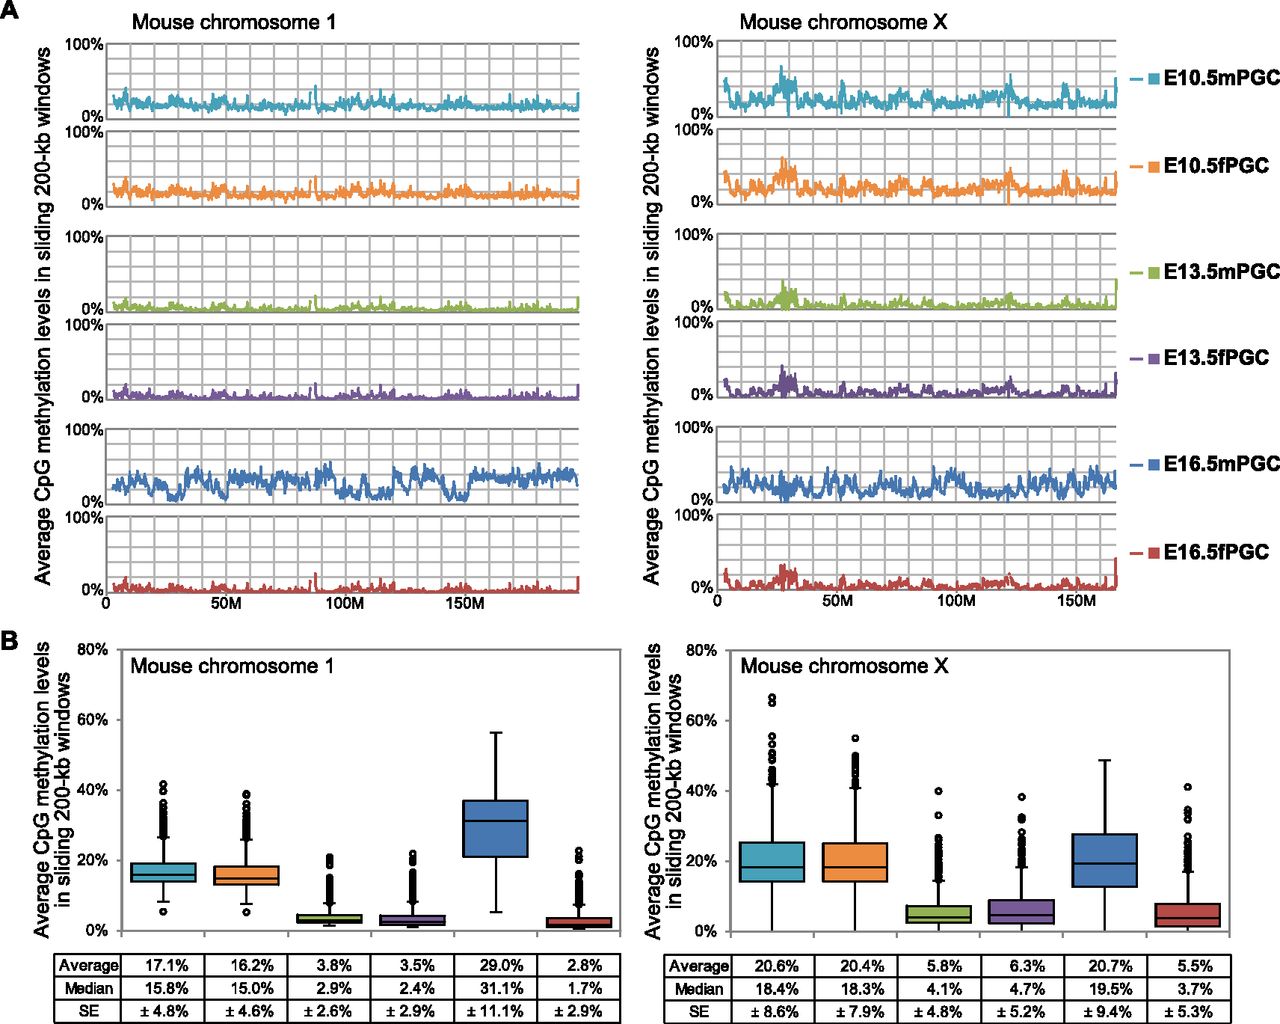
Figure 2.
DNA methylome maps of chromosome 1 and chromosome X in mouse PGCs. (A) Chromosome-wide distribution of CpG methylation in sliding 200-kb windows. (Colored lines) The methylation levels in each PGC. (B) Box plots of each methylation level in 200-kb windows. Average and median methylation levels and standard errors (SEs) are shown below the graphs.


