
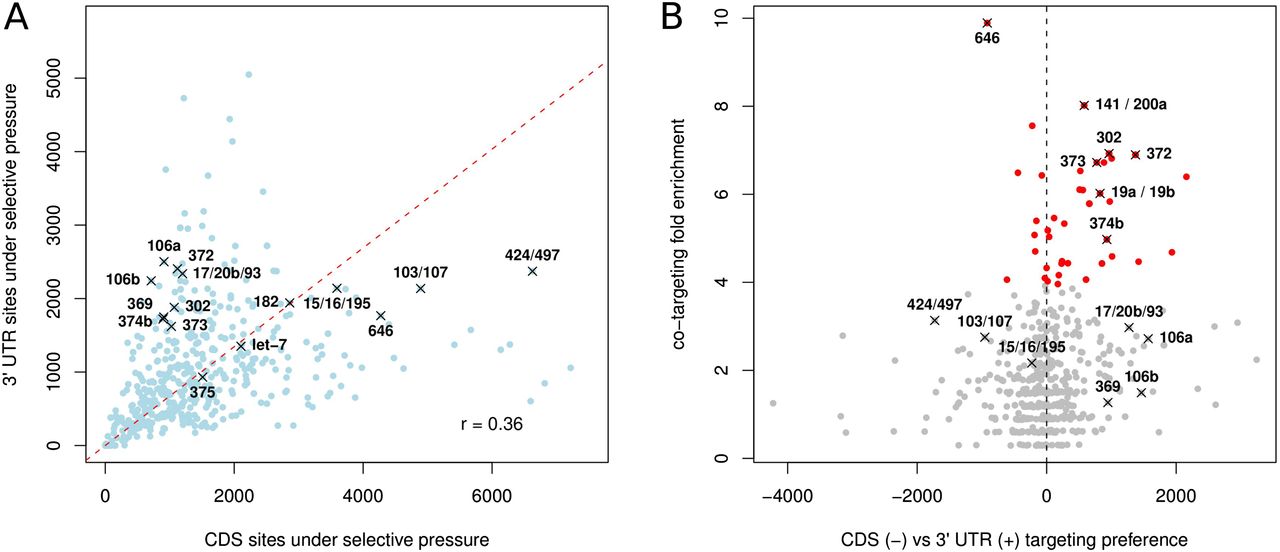
Individual miRNAs differ in their preference for targeting the CDS and the 3′ UTR as well as in their tendency to simultaneously target the CDS and the 3′ UTR of individual genes. (A) Number of complementary motifs, weighted by their respective ElMMo posteriors, of individual miRNAs in CDS vs. 3′ UTRs. (Red dashed line) Scaling between the number of CDS and 3′ UTR sites, defined as the line that goes through the origin and maximizes the projected variance. (B) Scatter plot of the CDS vs. 3′ UTR targeting preference of individual miRNAs against the fold enrichment in transcripts that are targeted in both the CDS and 3′ UTR relative to what would be expected if the sites were independently distributed. (Red dots) miRNAs with statistically significant co-targeting enrichment (P < 0.05 in Fisher's test after Bonferroni correction).


