
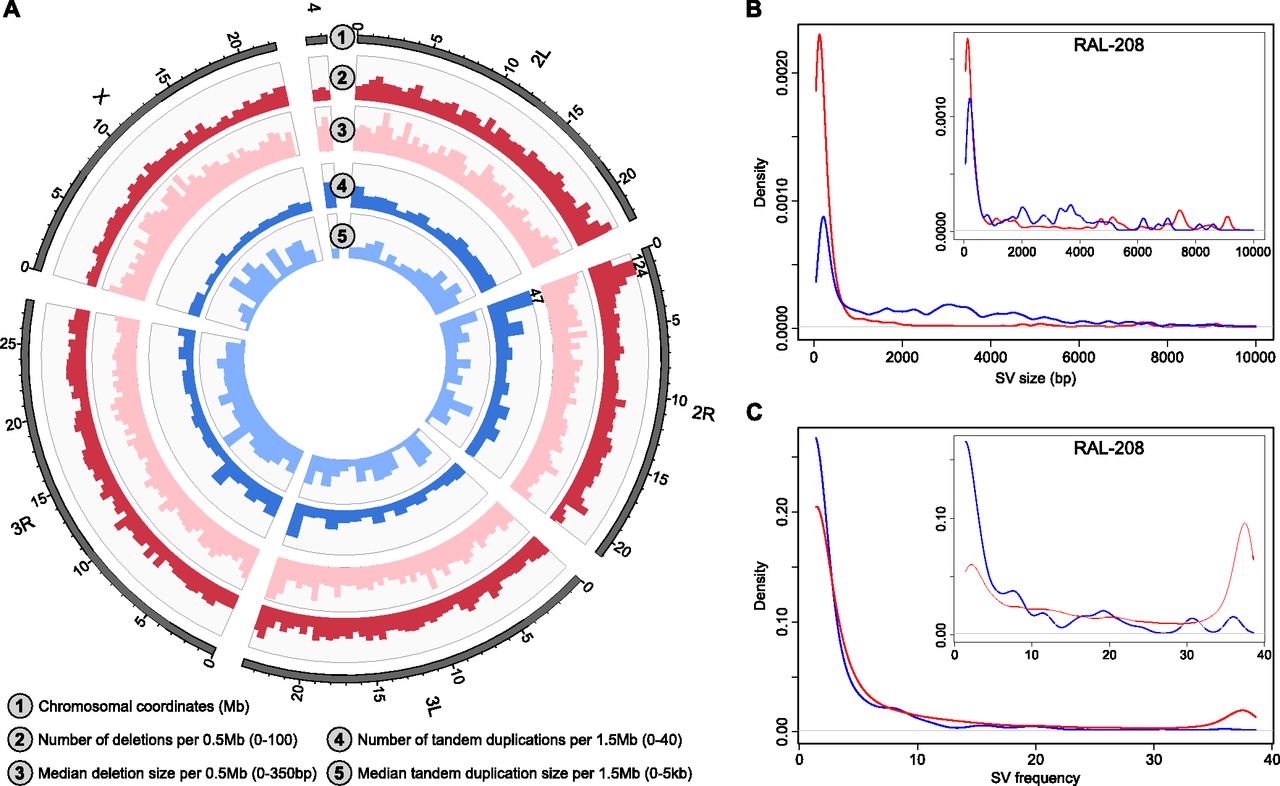
A sequencing-based map of SVs in the Drosophila melanogaster Genetic Reference Panel (DGRP). (A) Spatial and size distribution of deletions and tandem duplications in our SV discovery set. In two of the genomic windows indicated, which includes a SV hotspot region on chromosome 2R, the bars exceeded the displayed range (hence, their absolute height is indicated). (B) Size distribution of deletions (red) and tandem duplications (blue) in our entire discovery set (large plot) and in a single sample (RAL-208, small plot). The differences are owing to different frequency spectra of specific SV classes (see the Results section “Mechanisms of SV formation”). For deletions, several peaks are visible (e.g., 5, 7.5, and 9 kb), corresponding to mobile element insertions into the reference genome or to deletions of DNA transposons, which move by cut-and-paste mechanisms. (C) Frequency spectrum of deletions (red) and tandem duplications (blue) amongst 39 lines, indicated for the entire set of SVs (large plot) and for all SVs discovered in a single sample (RAL-208, small plot). While most SVs were discovered in less than five samples, a subset was present in >35 samples; most of the latter represent mobile element insertion and deletion events.


